Many Americans Have No Idea What Income Class They’re In

The middle class has traditionally been considered the pillar of American society and its economy. Throughout the era after World War II, incomes in the United States increased for all classes of Americans, especially the middle class. However, starting in the 1970s and 1980s, upper incomes soared while middle-class incomes stagnated, leading to a decades-long situation in which America’s middle class shrank.
An excellent, concise definition of middle class is offered by Pew Research Center. According to Pew, middle class can be defined by households earning “two-thirds to double the national median, after incomes have been adjusted for household size.” The U.S. median household income is $60,336 as of 2017, according to the U.S. Census Bureau’s latest American Community Survey data.
To better determine the size of America’s middle class, GOBankingRates conducted a poll asking Americans what income level they think they fall into: lower income, middle income or upper income. Five additional questions asked respondents their annual income, number of people in their household, highest level of education, day-to-day financial struggles and how much they have in savings, excluding retirement accounts.
What the survey results revealed is that, while America’s middle class is still large, people’s perception of where they stand could be distorting who in fact is middle class and who is not.
Almost 22% of Americans Incorrectly Think They’re Middle Class
According to the results of the survey, a little over 19 percent of lower-income Americans and a little over 2 percent of upper-income Americans mistakenly think they’re middle class, which, with rounding, equates to approximately 22 percent of Americans classifying themselves incorrectly.
On the flip side, there were some respondents who mistakenly thought they were not middle class. Roughly 3 percent of respondents mistakenly thought they were lower income and approximately 3 percent thought they were upper income.
This definition highlights the key factor of household size in determining whether you’re in the middle class or not. Check out the table below to see a breakdown of the necessary income levels to be middle class for different family sizes:
Defining Income Classes Based on Family Size | ||||
1 Person | 2-Person Families | 3-Person Families | 4-Person Families | |
Lower-Income Range | Less than $34,400 | Less than $43,693 | Less than $50,697 | Less than $60,499 |
Middle-Income Range | $34,400-$103,200 | $43,693-$131,078 | $50,697-$152,092 | $60,499-$181,496 |
Upper-Income Range | More than $103,200 | More than $131,078 | More than $152,092 | More than $181,496 |
Sources: Pew Research Center, U.S. Census Bureau | ||||
Household size is a critical factor shaping who’s middle class in America. And too often this point is overlooked, especially considering more than a fifth of survey respondents mistakenly think they’re middle class. For example, an individual earning the national median of $60,336 is well within the middle-class range. But if that earner were to become the sole breadwinner of a family of four, that household would no longer reach the middle-income threshold of $60,499.
Not accounting for household size could be part of the reason so many respondents mistakenly think they’re middle class. The table below breaks down the results for respondents who said they’re part of the middle class. The table only includes the results for households with up to four-person families, while the actual survey recorded family sizes that reached a maximum of 12 people per household.
Percentage of Americans Who Think They Are Middle Class | |||||
1 Person | 2-Person Families | 3-Person Families | 4-Person Families | Overall | |
Low-Income Households | 3.7% | 4.2% | 3.7% | 3.9% | 19% |
Middle-Income Households | 4.6% | 10.5% | 4.4% | 3.6% | 27% |
Upper-Income Households | 0.1% | 1.3% | 0.1% | 0.2% | 2% |
All Households | 8.5% | 16.1% | 8.3% | 7.7% | 49% |
Sources: Pew Research Center, U.S. Census Bureau. Note: Overall percentage includes families ranging from one person to 12 people. This chart only reflects the overall percentage and the percentages for one- through four-person families. | |||||
As you can see from the results, lower-income Americans are the most mistaken about where they lie in terms of “middle class,” with their responses adding up to roughly 19 percent of them believing they’re middle class. In total, 49 percent of households said they were middle class, which makes sense when you combine the 27 percent who correctly said they were middle class and the roughly 22 percent who are mistaken.
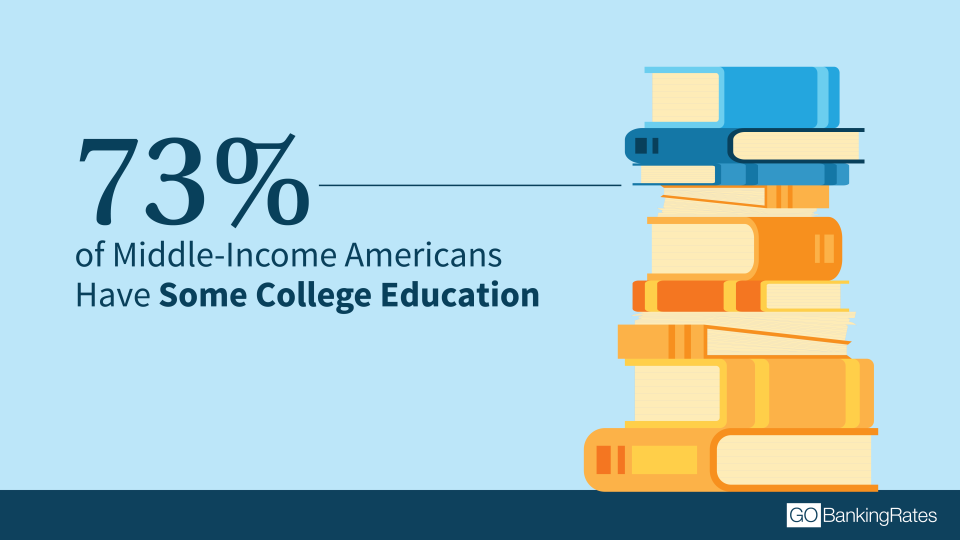
More Than Half of Middle-Income Americans Surveyed Have Some College Education
On the question, “What is your highest level of education?” the majority of middle-class respondents reported having some level of college education: 27 percent said “some college,” another 22 percent graduated with a bachelor’s degree and another 11 percent completed an associate’s degree.
However, that still left one-fifth of middle-income Americans with only a high school diploma or equivalent. That’s 11 percent less than low-income respondents (31 percent) but more than double that of upper-income respondents (8 percent) who said they attained a high school diploma or equivalent.
Education Levels for Lower-, Middle- and Upper-Income Americans | |||
Lower Income | Middle Income | Upper Income | |
High School Diploma or Equivalent | 31% | 20% | 8% |
Less Than High School | 10% | 5% | 9% |
Some College | 31% | 27% | 13% |
Bachelor’s Degree | 11% | 22% | 21% |
Master’s Degree | 3% | 9% | 22% |
Doctoral/Professional Degree | 1% | 4% | 17% |
Associate’s Degree | 8% | 11% | 7% |
Trade/Vocational School | 4% | 3% | 3% |
Education level has commonly been used as a measure for who is and isn’t middle class. According to the Brookings Institution, sociologists often use occupation or education to classify social class. But that criteria is fraught with subjectivity, as several experts define the level of education needed in different terms, with some saying a bachelor’s degree is required while others say only high school is enough. Hence why even the Brookings report does not define “middle class” in terms of education.
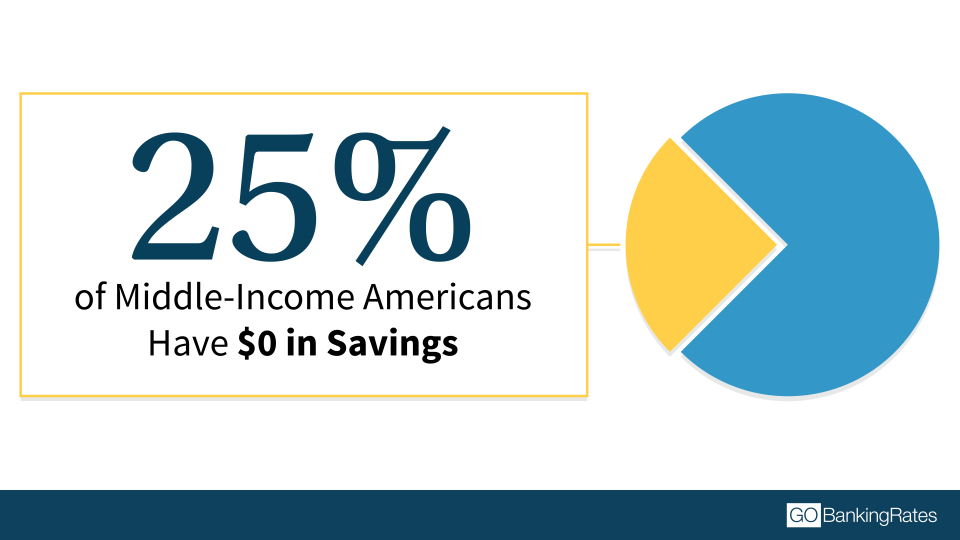
One in Four Middle-Income Americans Have $0 in Savings
Survey responses on the question of savings provided mixed results. On the one hand, 38 percent of middle-income respondents have $5,000 or more in savings, which is a positive sign for Americans. On the other hand, just under half of all middle-income respondents said they have less than $1,000 in savings: 21 percent with less than $1,000, plus 25 percent who have an alarming zero dollars in their savings accounts.
Here is the full breakdown of Americans’ savings by income class:
How Much Lower-, Middle- and Upper-Income Americans Have in Savings | |||
Lower Income | Middle Income | Upper Income | |
$0 | 55% | 25% | 11% |
Less than $1,000 | 25% | 21% | 6% |
$1,000-$4,999 | 8% | 16% | 4% |
$5,000-$9,999 | 4% | 11% | 6% |
$10,000-$19,999 | 4% | 8% | 11% |
$20,000-$49,999 | 2% | 8% | 9% |
$50,000 or more | 3% | 11% | 54% |
Figures represent the percentage of Americans in each income range who answered the survey question, “Approximately how much do you have in savings (not including retirement accounts)?” | |||
Middle-Income Americans Struggle With Saving, Budgeting and Affording Luxuries
The survey’s fifth question, “Which of the following statements apply to you?” asked respondents to identify their main, day-to-day financial pain points. Respondents could choose multiple responses. The results highlight critical struggles for middle-income Americans, as well as lower-income households.
The principal financial issues for middle-income respondents are the inability to afford luxury items every month (34 percent), and finding room in their budgets to save money (24 percent). On the positive side, 52 percent said that none of these financial struggles apply to them.
See the table below for the full breakdown of responses.
Financial Struggles for Lower-, Middle- and Upper-Income Americans | |||
Lower Income | Middle Income | Upper Income | |
Have trouble paying for housing expenses (rent, utilities) | 31% | 9% | 5% |
Have trouble finding room in my budget to save money | 41% | 24% | 8% |
Have trouble making minimum payments on my loans | 18% | 7% | 4% |
Have trouble paying for car expenses (gas, insurance) | 23% | 7% | 3% |
Have trouble paying for food expenses | 27% | 7% | 4% |
I can’t afford to splurge or buy luxury items every month | 51% | 34% | 13% |
None of the above | 30% | 52% | 80% |
Figures represent the percentage of Americans in each income range who answered the survey question, “Which of the following statements apply to you?” | |||
More worrying than the inability to afford luxuries is the 24 percent who cannot find the budget to save more money. This percentage supports the finding that 21 percent of middle-income respondents said they have less than a thousand dollars in savings — not to mention the 25 percent who said they have zero.
Future of the Middle Class
What the future has in store for the American middle class is hard to say, but it seems very uncertain. Just a few of the major headwinds it faces include rising costs of living, especially housing; rising healthcare costs; expensive higher education and increasing student loan debt; and growing income and wealth inequality. All these factors, and more, have helped contribute to a shrinking middle class in recent decades.
Higher education and a college degree, traditionally considered credentials for being middle class, have become much more expensive to achieve. According to the Federal Reserve Bank of New York, total student loan debt reached $1.44 trillion as of the third quarter of 2018 — higher than outstanding credit card and auto loan debt, and hardly a motivating figure for Americans who plan to take out loans to go to college.
Meanwhile, stagnating wages combined with rising costs of living are squeezing the middle class. Housing demand and prices are generally high across much of the country, making homeownership more difficult. This has made geography a crucial factor for middle-class Americans who want to live a richer life, but don’t have the wealth to do so in more expensive parts of the U.S.
Click through to read about how the U.S. has changed since the Great Recession.
More on Economy
We make money easy. Get weekly email updates, including expert advice to help you Live Richer™.
Methodology: The GOBankingRates survey posed the following questions to 2,007 Americans: 1) “To your best estimate, what income level are you in?”; 2) “What is your annual household income (before taxes)?”; 3) “How many people are in your household?”; 4) “What is your highest level of education?”; 5) “Which of the following statements apply to you?”; 6) “Approximately how much do you have in savings (not including retirement accounts)?” Some figures are rounded to the nearest whole number.
This article originally appeared on GOBankingRates.com: Many Americans Have No Idea What Income Class They’re In
