How Many National Grid plc (LON:NG.) Shares Do Institutions Own?
A look at the shareholders of National Grid plc (LON:NG.) can tell us which group is most powerful. Generally speaking, as a company grows, institutions will increase their ownership. Conversely, insiders often decrease their ownership over time. Companies that have been privatized tend to have low insider ownership.
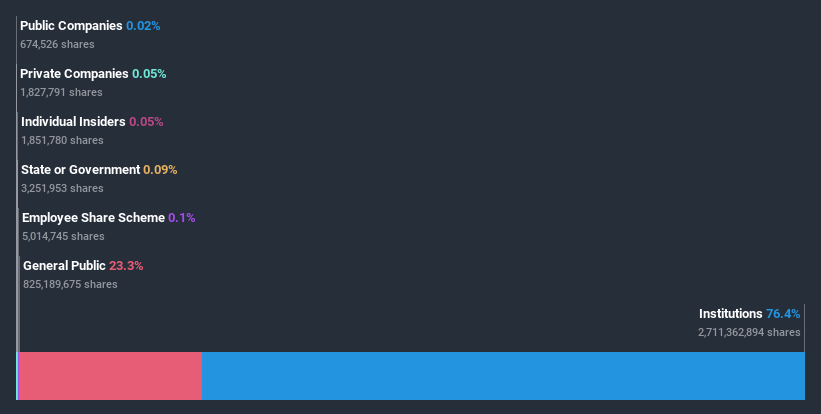
National Grid is a pretty big company. It has a market capitalization of UK£29b. Normally institutions would own a significant portion of a company this size. In the chart below, we can see that institutional investors have bought into the company. We can zoom in on the different ownership groups, to learn more about National Grid.
View our latest analysis for National Grid
What Does The Institutional Ownership Tell Us About National Grid?
Institutional investors commonly compare their own returns to the returns of a commonly followed index. So they generally do consider buying larger companies that are included in the relevant benchmark index.
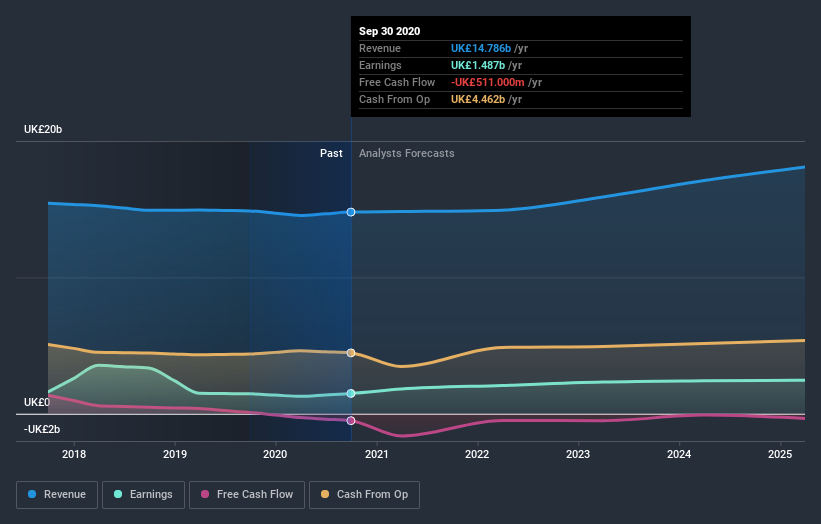
National Grid already has institutions on the share registry. Indeed, they own a respectable stake in the company. This suggests some credibility amongst professional investors. But we can't rely on that fact alone since institutions make bad investments sometimes, just like everyone does. It is not uncommon to see a big share price drop if two large institutional investors try to sell out of a stock at the same time. So it is worth checking the past earnings trajectory of National Grid, (below). Of course, keep in mind that there are other factors to consider, too.
Institutional investors own over 50% of the company, so together than can probably strongly influence board decisions. We note that hedge funds don't have a meaningful investment in National Grid. Our data shows that BlackRock, Inc. is the largest shareholder with 7.2% of shares outstanding. The Vanguard Group, Inc. is the second largest shareholder owning 4.2% of common stock, and Capital Research and Management Company holds about 2.9% of the company stock.
A deeper look at our ownership data shows that the top 25 shareholders collectively hold less than half of the register, suggesting a large group of small holders where no single shareholder has a majority.
Researching institutional ownership is a good way to gauge and filter a stock's expected performance. The same can be achieved by studying analyst sentiments. There are plenty of analysts covering the stock, so it might be worth seeing what they are forecasting, too.
Insider Ownership Of National Grid
While the precise definition of an insider can be subjective, almost everyone considers board members to be insiders. Management ultimately answers to the board. However, it is not uncommon for managers to be executive board members, especially if they are a founder or the CEO.
I generally consider insider ownership to be a good thing. However, on some occasions it makes it more difficult for other shareholders to hold the board accountable for decisions.
Our most recent data indicates that insiders own less than 1% of National Grid plc. As it is a large company, we'd only expect insiders to own a small percentage of it. But it's worth noting that they own UK£15m worth of shares. In this sort of situation, it can be more interesting to see if those insiders have been buying or selling.
General Public Ownership
The general public, with a 23% stake in the company, will not easily be ignored. While this group can't necessarily call the shots, it can certainly have a real influence on how the company is run.
Next Steps:
While it is well worth considering the different groups that own a company, there are other factors that are even more important. For example, we've discovered 2 warning signs for National Grid (1 is concerning!) that you should be aware of before investing here.
Ultimately the future is most important. You can access this free report on analyst forecasts for the company.
NB: Figures in this article are calculated using data from the last twelve months, which refer to the 12-month period ending on the last date of the month the financial statement is dated. This may not be consistent with full year annual report figures.
This article by Simply Wall St is general in nature. It does not constitute a recommendation to buy or sell any stock, and does not take account of your objectives, or your financial situation. We aim to bring you long-term focused analysis driven by fundamental data. Note that our analysis may not factor in the latest price-sensitive company announcements or qualitative material. Simply Wall St has no position in any stocks mentioned.
Have feedback on this article? Concerned about the content? Get in touch with us directly. Alternatively, email editorial-team (at) simplywallst.com.
