How Many Seven Group Holdings Limited (ASX:SVW) Shares Do Institutions Own?

If you want to know who really controls Seven Group Holdings Limited (ASX:SVW), then you'll have to look at the makeup of its share registry. Large companies usually have institutions as shareholders, and we usually see insiders owning shares in smaller companies. Companies that used to be publicly owned tend to have lower insider ownership.
Seven Group Holdings has a market capitalization of AU$6.2b, so it's too big to fly under the radar. We'd expect to see both institutions and retail investors owning a portion of the company. Our analysis of the ownership of the company, below, shows that institutions are noticeable on the share registry. We can zoom in on the different ownership groups, to learn more about SVW.
See our latest analysis for Seven Group Holdings
What Does The Institutional Ownership Tell Us About Seven Group Holdings?
Many institutions measure their performance against an index that approximates the local market. So they usually pay more attention to companies that are included in major indices.
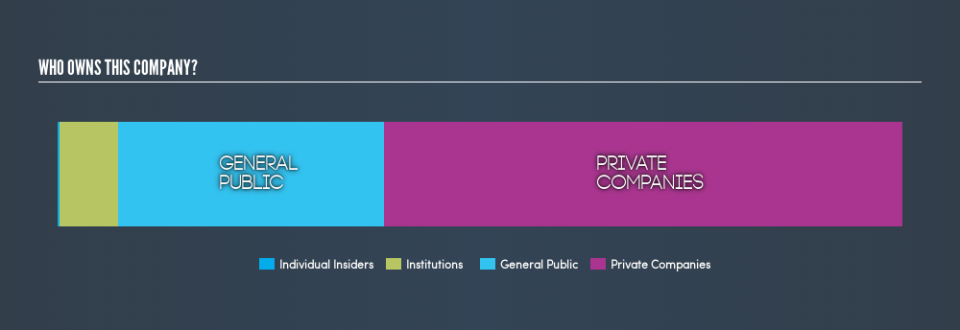
Seven Group Holdings already has institutions on the share registry. Indeed, they own 6.9% of the company. This can indicate that the company has a certain degree of credibility in the investment community. However, it is best to be wary of relying on the supposed validation that comes with institutional investors. They too, get it wrong sometimes. When multiple institutions own a stock, there's always a risk that they are in a 'crowded trade'. When such a trade goes wrong, multiple parties may compete to sell stock fast. This risk is higher in a company without a history of growth. You can see Seven Group Holdings's historic earnings and revenue, below, but keep in mind there's always more to the story.

Seven Group Holdings is not owned by hedge funds. There are plenty of analysts covering the stock, so it might be worth seeing what they are forecasting, too.
Insider Ownership Of Seven Group Holdings
While the precise definition of an insider can be subjective, almost everyone considers board members to be insiders. The company management answer to the board; and the latter should represent the interests of shareholders. Notably, sometimes top-level managers are on the board, themselves.
I generally consider insider ownership to be a good thing. However, on some occasions it makes it more difficult for other shareholders to hold the board accountable for decisions.
Our information suggests that Seven Group Holdings Limited insiders own under 1% of the company. However, it's possible that insiders might have an indirect interest through a more complex structure. It is a pretty big company, so it would be possible for board members to own a meaningful interest in the company, without owning much of a proportional interest. In this case, they own around AU$21m worth of shares (at current prices). It is good to see board members owning shares, but it might be worth checking if those insiders have been buying.
General Public Ownership
With a 32% ownership, the general public have some degree of sway over SVW. While this group can't necessarily call the shots, it can certainly have a real influence on how the company is run.
Private Company Ownership
Our data indicates that Private Companies hold 61%, of the company's shares. It's hard to draw any conclusions from this fact alone, so its worth looking into who owns those private companies. Sometimes insiders or other related parties have an interest in shares in a public company through a separate private company.
Next Steps:
It's always worth thinking about the different groups who own shares in a company. But to understand Seven Group Holdings better, we need to consider many other factors.
Many find it useful to take an in depth look at how a company has performed in the past. You can access this detailed graph of past earnings, revenue and cash flow .
If you would prefer discover what analysts are predicting in terms of future growth, do not miss this free report on analyst forecasts.
NB: Figures in this article are calculated using data from the last twelve months, which refer to the 12-month period ending on the last date of the month the financial statement is dated. This may not be consistent with full year annual report figures.
We aim to bring you long-term focused research analysis driven by fundamental data. Note that our analysis may not factor in the latest price-sensitive company announcements or qualitative material.
If you spot an error that warrants correction, please contact the editor at editorial-team@simplywallst.com. This article by Simply Wall St is general in nature. It does not constitute a recommendation to buy or sell any stock, and does not take account of your objectives, or your financial situation. Simply Wall St has no position in the stocks mentioned. Thank you for reading.

