Market Breadth Indicator Reveals The Next Big Move In S&P 500
Despite S&P 500 dropped more than 2% in last week together with extreme fear sentiment as shown in the Fear & Greed Index by CNN, there are more bullish entry setups (from 24 to 106), as reflected in the screenshot of the stock screener below.
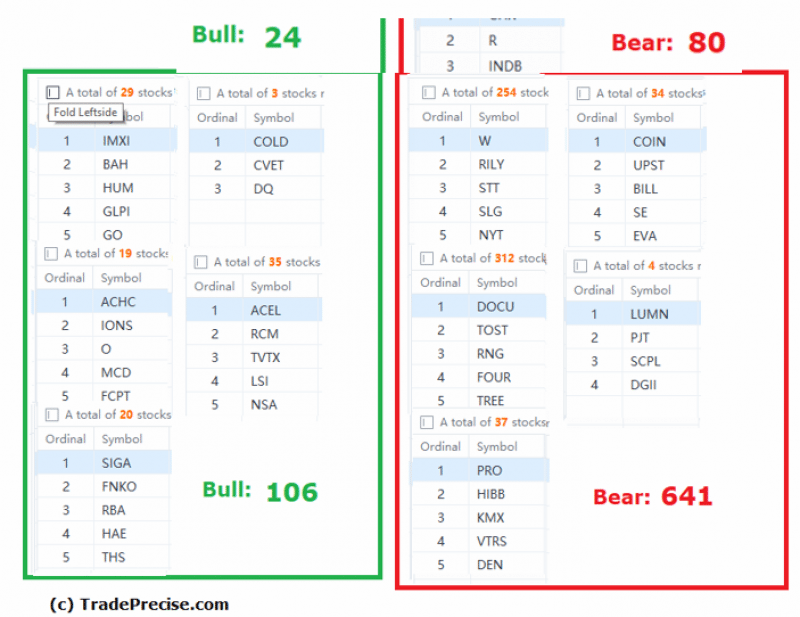
Apart from the potential accumulation in China stocks as explained in the video at the bottom of this post, selective stocks from the Biotech (XBI) and Consumer Staple (XLP) groups also show relative strength. The outperformance in these industry groups is significant because when the market turns to the upside, they are likely to be the leadership stocks on the way up.
Let’s look into the market breadth and the price volume behaviour in S&P 500 using the Wyckoff trading method to derive the clues and tell-tale signs in order to anticipate the next price movement.
Bullish Divergence Between S&P 500 and The Stock Market Breadth
The current market condition in S&P 500 is very similar to the development in March 2022, as shown in the comparison chart between S&P 500 and the market breadth (using 52-Week High – Low) below.
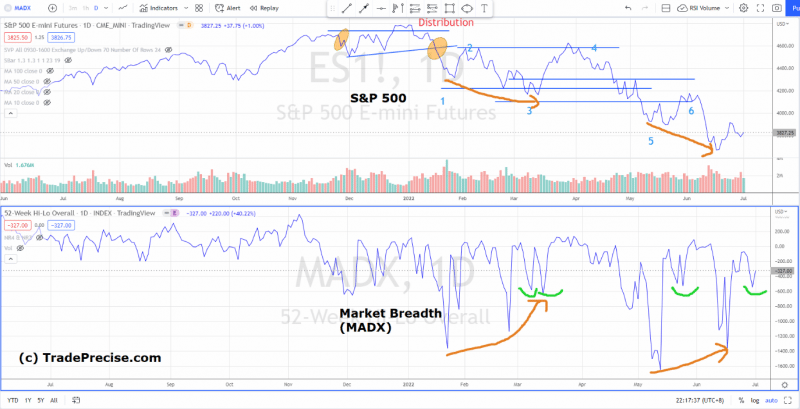
While S&P 500 was testing the previous low (annotated as 1) in February and March 2022 with a lower low (annotated in 3), the market breadth was forming a higher low. After the completion of the test, S&P 500 started a strong rally tested the resistance at 4600 (annotated in 4).
Similarly, while S&P 500 formed a lower low in Jun 2022, the market breadth formed a higher low. The improvement in the market breadth provides a bullish condition for a rally similar to March 2022.
The Falling Wedge Patterns Comparison in S&P 500
A falling wedge pattern (as annotated in blue) was developed since early April 2022 similar to the one developed in March 2022 (as annotated in orange) in S&P 500.

In terms of the price action, the thrust to the downside is getting smaller (as annotated in the blue arrow) similar to the falling wedge pattern formed in March 2022. This suggests the momentum to the downside is exhausted.
However, the sharp down move in June 2022 was accompanied by increasing of supply, which was tested last week as a higher low. Upon completion of the test, a strong rally similar to the one started in 15 March 2022 could be expected.
The price target for S&P 500 is at 4100-4200, which is the axis zone where the previous support-turned-resistance. The previous gap resistance at 3900 is to be overcome ideally with supply absorption characteristics before heading to the next price target. Should S&P 500 break below the swing low at 3640, this could violate the bullish scenario and a re-assessment is needed.
Spot The Outperforming Stocks in The Next Bull Run
The best time to spot the outperforming stocks is during market correction or even the bear market, which is now. The rationale behind the outperformance in selective stocks or industry groups / themes is mainly due to market rotation as the smart money is rotated out from the laggard into leading groups.
As mentioned earlier on, watch the video below to find out why China stocks could be ready for the next bull run and how you could prepare and participate.
The outperforming stocks in a leading industry group or theme are likely to generate more return and sustainable when the tide turns. Visit TradePrecise.com to get more stock market insights in email for free.
This article was originally posted on FX Empire
More From FXEMPIRE:
Trade Of The Week: Volatile Week For Dollar As Focus Shifts To NFP?
Rwanda’s Kagame has no problem being excluded from Congo regional military force
Forget ‘arguments of the past,’ UK’s Labour sets out Brexit plan
Israel, Poland to restore relations strained by Holocaust restitution row
Macron appoints COVID minister to be new face of government policy

