Market Election Correction - How Deep Will It Be? | MMI Report October 2020

October 2020 MMI Report
Will pre-election jitters hit the market?

Market Sentiment: Negative
After the late September and early October rally, bulls outnumber bears 1.08 to 1 and the NYSE is overbought at .71. The put to call ratio on CBOE equity also is low at 0.47. Only the VIX and VXN remain elevated at 27 and 35. Also the confidence index is positive as spreads between high quality and junk remain wide. Only two of our 10 indicators in this category are bullish.
Technical Indicators: Bullish
Eight out of ten of our data inputs register a bullish tone. On the NYSE, new highs out number new lows by a 2.4 to 1 ratio. Aggregate advancing volume outweighs declining volume 1.51 - 1. Advancing issues outnumbered declining issues by 1.74 to 1. All major market indices are comfortably above their 200-day moving average, led by the NASDAQ at +18.3% followed by the micro-cap index at +13.2% and then the small cap index at +11.7%. This is upward trend is confirmed by equal weighted indices on the S&P 500 up 9.8% and on the small cap index up 11.7%. This phenomenon may be an indication that the overall market is slightly extended.
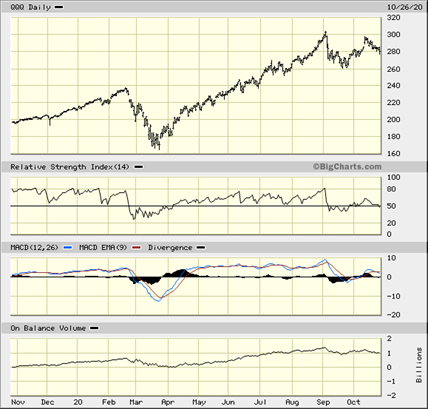
Exhibit 1: 1-Year Chart of Nasdaq 100
Liquidity Indicators: Negative
Margin accounts are showing high leverage on a long-term basis but are within normal parameters in the near term at about 33% cash to debit balances. Cash in money funds are at significantly outsized levels at $4.35 trillion, representing nearly 12% of total equity market cap, nearly twice the historical mean. However, monthly net cash flows are negative at $(33) billion. There have been a dearth of buybacks and M&A deals with the Morgan Stanley buyout offer of Eaton Vance for $7 billion taking the headlines. IPOs are dominated by SPACs, comprising over 50% of all offerings. This highly popular financing vehicle gives investors an advantage, a put feature where if they do not like the deal proposed with their funds within 2 years, they can redeem at par. IPOs and secondaries have amounted to $15 billion. Hedge fund outflows are estimated to be $17.4 billion per Eureka Hedge. In summary, our liquidity indicators are negative with an aggregate outflow over the last 4 weeks of approximately $65 billion.
EPS Momentum: Positive
25% of all equities currently have reported and upside surprises have exceeded downside surprises by 4 to 1. Q3 2020 EPS estimates have been revised higher as have Q4 and full year 2021 estimates.
Valuation: Negative
The equity market indices continue to underscore the wide divergence between growth and value in large and small-cap stocks. Small and mid-cap growth stocks are on the cusp of overvalued, measured by our proxy the T. Rowe Price New Horizons fund, trading approximately 1.5 times the current S&P 500 P/E ratio. Examining these divergences further, we currently find the Russell 2000 trades at 15.9 times TTM earnings, the Russell microcap at 11.5, and the S&P 500 at 25.9. Our valuation model shows the S&P 500 should trade at 28.5 times. Therefore, we project 2020 earnings at $130.08 which generates a fair value of 3,716, +7.25%. When we apply an equity market discount of 10%, we arrive at a fair value of 3,345, (3.4)% from last week’s close at 3,457. This overvalued condition is confirmed by our contemporary equivalent of the Tobin's q ratio. We find that the total market cap of our equity markets exceeds total GDP by 1.85 times. This amount exceeds our fair value level of 1.5x so it is elevated but still below the all-time high registered in the year 2000 of 2.3 times. Our relative valuation indicator which compares the earnings yield versus the BBB corporate bond yield shows an equity market that is slightly undervalued. The current EPS yield exceeds the corporate bond yield by 36 basis points. Equities would have to rise approximately 10% to reach parity to bonds.
Monetary Indicators: Positive
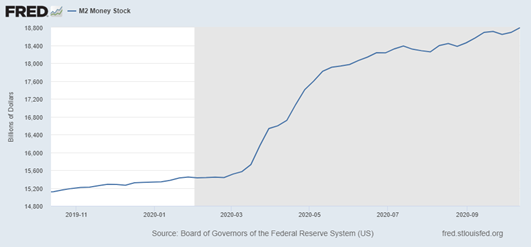
Due to the extreme actions of the Fed to stimulate the economy in the face of the pandemic, M2 growth year over year currently exceeds 23%. This outstanding growth faces heavy headwinds due to a decline in recession-driven money velocity of -22.8%. The net result is a mild excess liquidity stimulus of 29 basis points. Q2 nominal GDP was -4.97%, clearly heavier monetary stimulus is necessary.
Exhibit 2: TTM Growth of M2
The term spread of the treasury yield curve slope is positive. The forward rate of the one year T-bill is also stimulative forecasting +0.17.
Fed funds trade at a slight discount to 3-month T-bills, but also positive.
And finally, the yield spread of high yield to treasuries is bullish at +413 basis points.
As we move into the uncertainty of the 2020 presidential election outcome, the net result is that the market is slightly overvalued and slightly extended from a technical perspective. Intermediate underpinnings are positive led by improving earnings momentum and EPS growth trends. This positivity is supported by solid near-term technical momentum while sentiment has become slightly too bullish. We believe a five to ten percent correction is warranted based on our data.
Robert Maltbie, CFA
President, Singular Research
818-222-6915
Trial Subscription Offer: https://singularresearch.com/index.php/en/

