Is Marshall Machines Limited's (NSE:MARSHALL) P/E Ratio Really That Good?

Want to participate in a short research study? Help shape the future of investing tools and you could win a $250 gift card!
This article is written for those who want to get better at using price to earnings ratios (P/E ratios). We'll show how you can use Marshall Machines Limited's (NSE:MARSHALL) P/E ratio to inform your assessment of the investment opportunity. Looking at earnings over the last twelve months, Marshall Machines has a P/E ratio of 4.33. That corresponds to an earnings yield of approximately 23%.
View our latest analysis for Marshall Machines
How Do I Calculate A Price To Earnings Ratio?
The formula for price to earnings is:
Price to Earnings Ratio = Share Price ÷ Earnings per Share (EPS)
Or for Marshall Machines:
P/E of 4.33 = ₹21.5 ÷ ₹4.97 (Based on the year to March 2019.)
Is A High P/E Ratio Good?
The higher the P/E ratio, the higher the price tag of a business, relative to its trailing earnings. That isn't necessarily good or bad, but a high P/E implies relatively high expectations of what a company can achieve in the future.
How Growth Rates Impact P/E Ratios
P/E ratios primarily reflect market expectations around earnings growth rates. When earnings grow, the 'E' increases, over time. That means unless the share price increases, the P/E will reduce in a few years. A lower P/E should indicate the stock is cheap relative to others -- and that may attract buyers.
Marshall Machines shrunk earnings per share by 9.2% last year. But it has grown its earnings per share by 50% per year over the last five years.
How Does Marshall Machines's P/E Ratio Compare To Its Peers?
We can get an indication of market expectations by looking at the P/E ratio. If you look at the image below, you can see Marshall Machines has a lower P/E than the average (14.4) in the machinery industry classification.
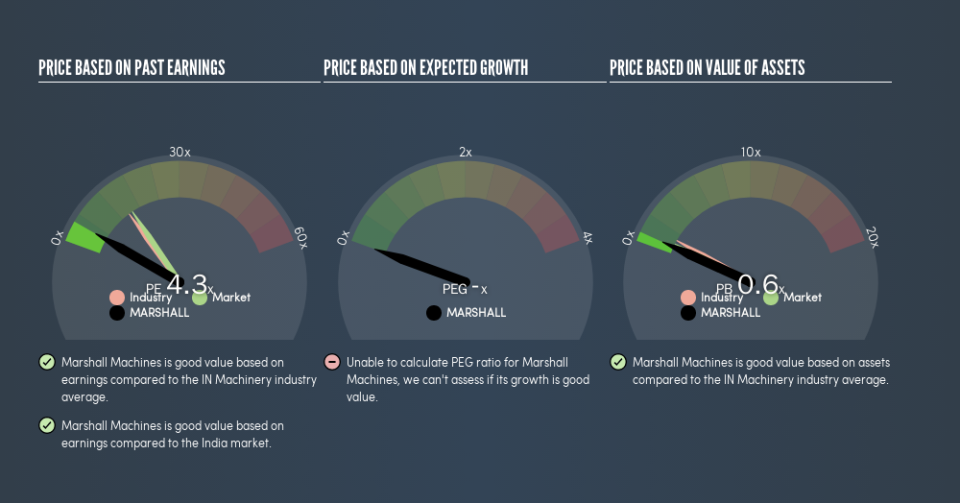
This suggests that market participants think Marshall Machines will underperform other companies in its industry. Since the market seems unimpressed with Marshall Machines, it's quite possible it could surprise on the upside. You should delve deeper. I like to check if company insiders have been buying or selling.
Don't Forget: The P/E Does Not Account For Debt or Bank Deposits
Don't forget that the P/E ratio considers market capitalization. That means it doesn't take debt or cash into account. In theory, a company can lower its future P/E ratio by using cash or debt to invest in growth.
Spending on growth might be good or bad a few years later, but the point is that the P/E ratio does not account for the option (or lack thereof).
So What Does Marshall Machines's Balance Sheet Tell Us?
Net debt totals 70% of Marshall Machines's market cap. If you want to compare its P/E ratio to other companies, you should absolutely keep in mind it has significant borrowings.
The Bottom Line On Marshall Machines's P/E Ratio
Marshall Machines's P/E is 4.3 which is below average (15.5) in the IN market. The P/E reflects market pessimism that probably arises from the lack of recent EPS growth, paired with significant leverage.
Investors should be looking to buy stocks that the market is wrong about. If it is underestimating a company, investors can make money by buying and holding the shares until the market corrects itself. Although we don't have analyst forecasts, shareholders might want to examine this detailed historical graph of earnings, revenue and cash flow.
But note: Marshall Machines may not be the best stock to buy. So take a peek at this free list of interesting companies with strong recent earnings growth (and a P/E ratio below 20).
We aim to bring you long-term focused research analysis driven by fundamental data. Note that our analysis may not factor in the latest price-sensitive company announcements or qualitative material.
If you spot an error that warrants correction, please contact the editor at editorial-team@simplywallst.com. This article by Simply Wall St is general in nature. It does not constitute a recommendation to buy or sell any stock, and does not take account of your objectives, or your financial situation. Simply Wall St has no position in the stocks mentioned. Thank you for reading.
