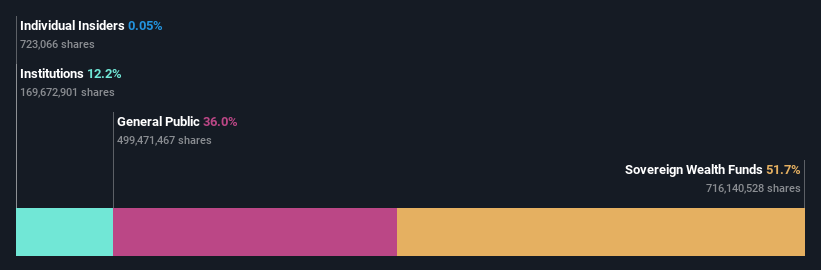
Mercury NZ Limited's (NZSE:MCY) top owners are sovereign wealth funds with 52% stake, while 36% is held by individual investors
Every investor in Mercury NZ Limited (NZSE:MCY) should be aware of the most powerful shareholder groups. The group holding the most number of shares in the company, around 52% to be precise, is sovereign wealth funds. Put another way, the group faces the maximum upside potential (or downside risk).
Meanwhile, individual investors make up 36% of the company’s shareholders.
Let's take a closer look to see what the different types of shareholders can tell us about Mercury NZ.
View our latest analysis for Mercury NZ
What Does The Institutional Ownership Tell Us About Mercury NZ?
Institutions typically measure themselves against a benchmark when reporting to their own investors, so they often become more enthusiastic about a stock once it's included in a major index. We would expect most companies to have some institutions on the register, especially if they are growing.
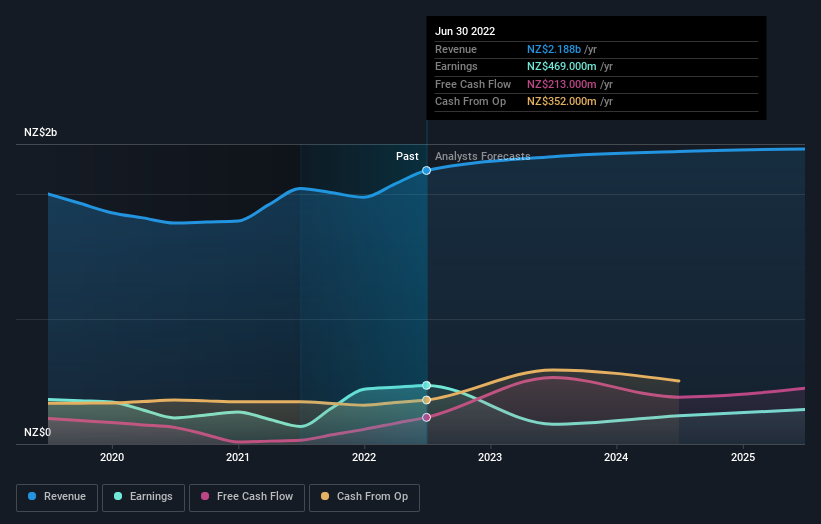
We can see that Mercury NZ does have institutional investors; and they hold a good portion of the company's stock. This suggests some credibility amongst professional investors. But we can't rely on that fact alone since institutions make bad investments sometimes, just like everyone does. It is not uncommon to see a big share price drop if two large institutional investors try to sell out of a stock at the same time. So it is worth checking the past earnings trajectory of Mercury NZ, (below). Of course, keep in mind that there are other factors to consider, too.
Mercury NZ is not owned by hedge funds. The company's largest shareholder is New Zealand Superannuation Fund, with ownership of 52%. With such a huge stake in the ownership, we infer that they have significant control of the future of the company. Meanwhile, the second and third largest shareholders, hold 3.5% and 2.1%, of the shares outstanding, respectively.
Researching institutional ownership is a good way to gauge and filter a stock's expected performance. The same can be achieved by studying analyst sentiments. There are a reasonable number of analysts covering the stock, so it might be useful to find out their aggregate view on the future.
Insider Ownership Of Mercury NZ
The definition of company insiders can be subjective and does vary between jurisdictions. Our data reflects individual insiders, capturing board members at the very least. Company management run the business, but the CEO will answer to the board, even if he or she is a member of it.
Most consider insider ownership a positive because it can indicate the board is well aligned with other shareholders. However, on some occasions too much power is concentrated within this group.
Our data suggests that insiders own under 1% of Mercury NZ Limited in their own names. It is a pretty big company, so it would be possible for board members to own a meaningful interest in the company, without owning much of a proportional interest. In this case, they own around NZ$3.8m worth of shares (at current prices). It is always good to see at least some insider ownership, but it might be worth checking if those insiders have been selling.
General Public Ownership
With a 36% ownership, the general public, mostly comprising of individual investors, have some degree of sway over Mercury NZ. This size of ownership, while considerable, may not be enough to change company policy if the decision is not in sync with other large shareholders.
Next Steps:
While it is well worth considering the different groups that own a company, there are other factors that are even more important. Consider for instance, the ever-present spectre of investment risk. We've identified 3 warning signs with Mercury NZ (at least 1 which makes us a bit uncomfortable) , and understanding them should be part of your investment process.
If you would prefer discover what analysts are predicting in terms of future growth, do not miss this free report on analyst forecasts.
NB: Figures in this article are calculated using data from the last twelve months, which refer to the 12-month period ending on the last date of the month the financial statement is dated. This may not be consistent with full year annual report figures.
Have feedback on this article? Concerned about the content? Get in touch with us directly. Alternatively, email editorial-team (at) simplywallst.com.
This article by Simply Wall St is general in nature. We provide commentary based on historical data and analyst forecasts only using an unbiased methodology and our articles are not intended to be financial advice. It does not constitute a recommendation to buy or sell any stock, and does not take account of your objectives, or your financial situation. We aim to bring you long-term focused analysis driven by fundamental data. Note that our analysis may not factor in the latest price-sensitive company announcements or qualitative material. Simply Wall St has no position in any stocks mentioned.
Join A Paid User Research Session
You’ll receive a US$30 Amazon Gift card for 1 hour of your time while helping us build better investing tools for the individual investors like yourself. Sign up here
