Metropolis Healthcare Limited (NSE:METROPOLIS) Earns A Nice Return On Capital Employed

Want to participate in a short research study? Help shape the future of investing tools and you could win a $250 gift card!
Today we are going to look at Metropolis Healthcare Limited (NSE:METROPOLIS) to see whether it might be an attractive investment prospect. To be precise, we'll consider its Return On Capital Employed (ROCE), as that will inform our view of the quality of the business.
Firstly, we'll go over how we calculate ROCE. Then we'll compare its ROCE to similar companies. Last but not least, we'll look at what impact its current liabilities have on its ROCE.
Return On Capital Employed (ROCE): What is it?
ROCE measures the 'return' (pre-tax profit) a company generates from capital employed in its business. Generally speaking a higher ROCE is better. In brief, it is a useful tool, but it is not without drawbacks. Author Edwin Whiting says to be careful when comparing the ROCE of different businesses, since 'No two businesses are exactly alike.'
So, How Do We Calculate ROCE?
The formula for calculating the return on capital employed is:
Return on Capital Employed = Earnings Before Interest and Tax (EBIT) ÷ (Total Assets - Current Liabilities)
Or for Metropolis Healthcare:
0.45 = ₹1.9b ÷ (₹5.5b - ₹1.2b) (Based on the trailing twelve months to March 2019.)
Therefore, Metropolis Healthcare has an ROCE of 45%.
View our latest analysis for Metropolis Healthcare
Does Metropolis Healthcare Have A Good ROCE?
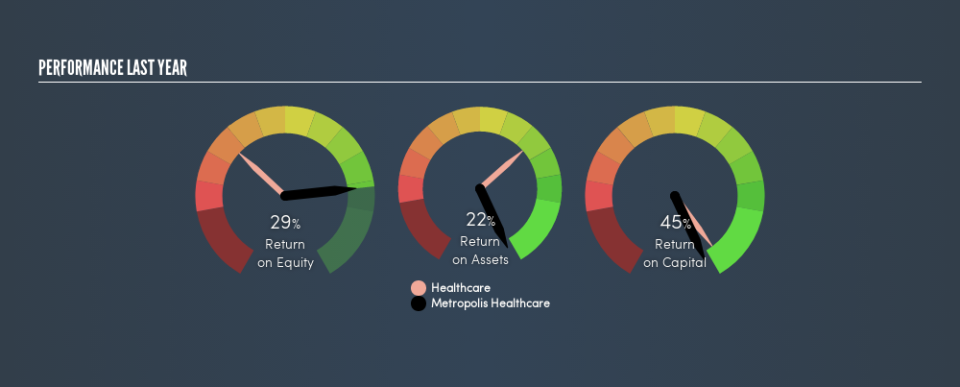
ROCE is commonly used for comparing the performance of similar businesses. Metropolis Healthcare's ROCE appears to be substantially greater than the 16% average in the Healthcare industry. We consider this a positive sign, because it suggests it uses capital more efficiently than similar companies. Regardless of the industry comparison, in absolute terms, Metropolis Healthcare's ROCE currently appears to be excellent.
Our data shows that Metropolis Healthcare currently has an ROCE of 45%, compared to its ROCE of 29% 3 years ago. This makes us think the business might be improving. The image below shows how Metropolis Healthcare's ROCE compares to its industry, and you can click it to see more detail on its past growth.
Remember that this metric is backwards looking - it shows what has happened in the past, and does not accurately predict the future. ROCE can be deceptive for cyclical businesses, as returns can look incredible in boom times, and terribly low in downturns. ROCE is only a point-in-time measure. Since the future is so important for investors, you should check out our free report on analyst forecasts for Metropolis Healthcare.
Metropolis Healthcare's Current Liabilities And Their Impact On Its ROCE
Current liabilities include invoices, such as supplier payments, short-term debt, or a tax bill, that need to be paid within 12 months. The ROCE equation subtracts current liabilities from capital employed, so a company with a lot of current liabilities appears to have less capital employed, and a higher ROCE than otherwise. To counteract this, we check if a company has high current liabilities, relative to its total assets.
Metropolis Healthcare has total assets of ₹5.5b and current liabilities of ₹1.2b. Therefore its current liabilities are equivalent to approximately 23% of its total assets. The fairly low level of current liabilities won't have much impact on the already great ROCE.
What We Can Learn From Metropolis Healthcare's ROCE
Low current liabilities and high ROCE is a good combination, making Metropolis Healthcare look quite interesting. Metropolis Healthcare shapes up well under this analysis, but it is far from the only business delivering excellent numbers . You might also want to check this free collection of companies delivering excellent earnings growth.
I will like Metropolis Healthcare better if I see some big insider buys. While we wait, check out this free list of growing companies with considerable, recent, insider buying.
We aim to bring you long-term focused research analysis driven by fundamental data. Note that our analysis may not factor in the latest price-sensitive company announcements or qualitative material.
If you spot an error that warrants correction, please contact the editor at editorial-team@simplywallst.com. This article by Simply Wall St is general in nature. It does not constitute a recommendation to buy or sell any stock, and does not take account of your objectives, or your financial situation. Simply Wall St has no position in the stocks mentioned. Thank you for reading.

