What Can We Make Of Micron Technology, Inc.’s (NASDAQ:MU) High Return On Capital?

Today we'll evaluate Micron Technology, Inc. (NASDAQ:MU) to determine whether it could have potential as an investment idea. To be precise, we'll consider its Return On Capital Employed (ROCE), as that will inform our view of the quality of the business.
First, we'll go over how we calculate ROCE. Then we'll compare its ROCE to similar companies. Then we'll determine how its current liabilities are affecting its ROCE.
What is Return On Capital Employed (ROCE)?
ROCE measures the 'return' (pre-tax profit) a company generates from capital employed in its business. All else being equal, a better business will have a higher ROCE. Ultimately, it is a useful but imperfect metric. Author Edwin Whiting says to be careful when comparing the ROCE of different businesses, since 'No two businesses are exactly alike.'
So, How Do We Calculate ROCE?
The formula for calculating the return on capital employed is:
Return on Capital Employed = Earnings Before Interest and Tax (EBIT) ÷ (Total Assets - Current Liabilities)
Or for Micron Technology:
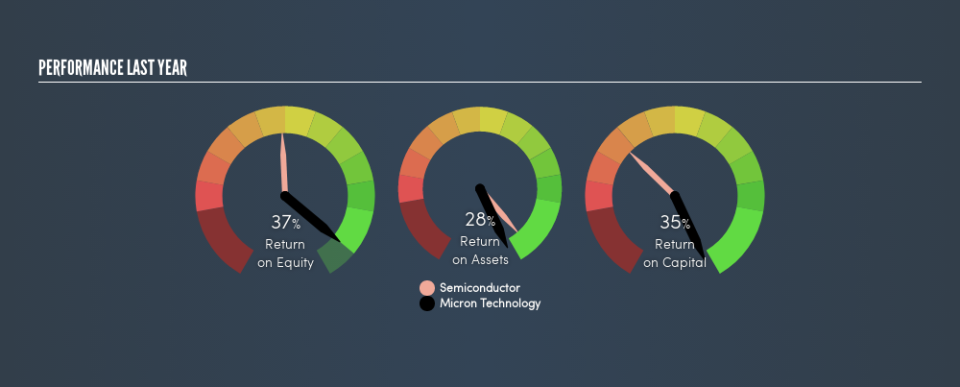
0.35 = US$14b ÷ (US$47b - US$7.4b) (Based on the trailing twelve months to February 2019.)
So, Micron Technology has an ROCE of 35%.
See our latest analysis for Micron Technology
Does Micron Technology Have A Good ROCE?
ROCE is commonly used for comparing the performance of similar businesses. Using our data, we find that Micron Technology's ROCE is meaningfully better than the 12% average in the Semiconductor industry. We would consider this a positive, as it suggests it is using capital more effectively than other similar companies. Putting aside its position relative to its industry for now, in absolute terms, Micron Technology's ROCE is currently very good.
In our analysis, Micron Technology's ROCE appears to be 35%, compared to 3 years ago, when its ROCE was 6.5%. This makes us think the business might be improving.
When considering ROCE, bear in mind that it reflects the past and does not necessarily predict the future. Companies in cyclical industries can be difficult to understand using ROCE, as returns typically look high during boom times, and low during busts. ROCE is, after all, simply a snap shot of a single year. What happens in the future is pretty important for investors, so we have prepared a free report on analyst forecasts for Micron Technology.
What Are Current Liabilities, And How Do They Affect Micron Technology's ROCE?
Current liabilities are short term bills and invoices that need to be paid in 12 months or less. Due to the way the ROCE equation works, having large bills due in the near term can make it look as though a company has less capital employed, and thus a higher ROCE than usual. To check the impact of this, we calculate if a company has high current liabilities relative to its total assets.
Micron Technology has total liabilities of US$7.4b and total assets of US$47b. As a result, its current liabilities are equal to approximately 16% of its total assets. The fairly low level of current liabilities won't have much impact on the already great ROCE.
What We Can Learn From Micron Technology's ROCE
Low current liabilities and high ROCE is a good combination, making Micron Technology look quite interesting. Micron Technology shapes up well under this analysis, but it is far from the only business delivering excellent numbers . You might also want to check this free collection of companies delivering excellent earnings growth.
I will like Micron Technology better if I see some big insider buys. While we wait, check out this free list of growing companies with considerable, recent, insider buying.
We aim to bring you long-term focused research analysis driven by fundamental data. Note that our analysis may not factor in the latest price-sensitive company announcements or qualitative material.
If you spot an error that warrants correction, please contact the editor at editorial-team@simplywallst.com. This article by Simply Wall St is general in nature. It does not constitute a recommendation to buy or sell any stock, and does not take account of your objectives, or your financial situation. Simply Wall St has no position in the stocks mentioned. Thank you for reading.

