Can Mixed Fundamentals Have A Negative Impact on VEEM Ltd (ASX:VEE) Current Share Price Momentum?

Most readers would already be aware that VEEM's (ASX:VEE) stock increased significantly by 19% over the past three months. However, we decided to pay attention to the company's fundamentals which don't appear to give a clear sign about the company's financial health. Specifically, we decided to study VEEM's ROE in this article.
ROE or return on equity is a useful tool to assess how effectively a company can generate returns on the investment it received from its shareholders. In short, ROE shows the profit each dollar generates with respect to its shareholder investments.
See our latest analysis for VEEM
How Is ROE Calculated?
ROE can be calculated by using the formula:
Return on Equity = Net Profit (from continuing operations) ÷ Shareholders' Equity
So, based on the above formula, the ROE for VEEM is:
7.6% = AU$2.5m ÷ AU$33m (Based on the trailing twelve months to June 2020).
The 'return' is the amount earned after tax over the last twelve months. So, this means that for every A$1 of its shareholder's investments, the company generates a profit of A$0.08.
Why Is ROE Important For Earnings Growth?
We have already established that ROE serves as an efficient profit-generating gauge for a company's future earnings. Based on how much of its profits the company chooses to reinvest or "retain", we are then able to evaluate a company's future ability to generate profits. Assuming everything else remains unchanged, the higher the ROE and profit retention, the higher the growth rate of a company compared to companies that don't necessarily bear these characteristics.
VEEM's Earnings Growth And 7.6% ROE
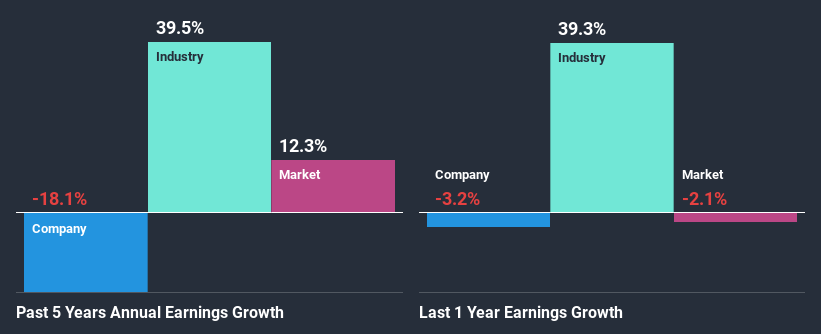
At first glance, VEEM's ROE doesn't look very promising. A quick further study shows that the company's ROE doesn't compare favorably to the industry average of 12% either. Given the circumstances, the significant decline in net income by 18% seen by VEEM over the last five years is not surprising. We reckon that there could also be other factors at play here. For example, it is possible that the business has allocated capital poorly or that the company has a very high payout ratio.
So, as a next step, we compared VEEM's performance against the industry and were disappointed to discover that while the company has been shrinking its earnings, the industry has been growing its earnings at a rate of 39% in the same period.
The basis for attaching value to a company is, to a great extent, tied to its earnings growth. It’s important for an investor to know whether the market has priced in the company's expected earnings growth (or decline). This then helps them determine if the stock is placed for a bright or bleak future. Is VEEM fairly valued compared to other companies? These 3 valuation measures might help you decide.
Is VEEM Efficiently Re-investing Its Profits?
In spite of a normal three-year median payout ratio of 30% (that is, a retention ratio of 70%), the fact that VEEM's earnings have shrunk is quite puzzling. So there might be other factors at play here which could potentially be hampering growth. For example, the business has faced some headwinds.
In addition, VEEM has been paying dividends over a period of three years suggesting that keeping up dividend payments is preferred by the management even though earnings have been in decline.
Summary
Overall, we have mixed feelings about VEEM. While the company does have a high rate of profit retention, its low rate of return is probably hampering its earnings growth. Wrapping up, we would proceed with caution with this company and one way of doing that would be to look at the risk profile of the business. To know the 3 risks we have identified for VEEM visit our risks dashboard for free.
This article by Simply Wall St is general in nature. It does not constitute a recommendation to buy or sell any stock, and does not take account of your objectives, or your financial situation. We aim to bring you long-term focused analysis driven by fundamental data. Note that our analysis may not factor in the latest price-sensitive company announcements or qualitative material. Simply Wall St has no position in any stocks mentioned.
Have feedback on this article? Concerned about the content? Get in touch with us directly. Alternatively, email editorial-team@simplywallst.com.
