Momentum Group AB (publ) (STO:MMGR B) Earns Among The Best Returns In Its Industry

Today we'll evaluate Momentum Group AB (publ) (STO:MMGR B) to determine whether it could have potential as an investment idea. To be precise, we'll consider its Return On Capital Employed (ROCE), as that will inform our view of the quality of the business.
First, we'll go over how we calculate ROCE. Then we'll compare its ROCE to similar companies. Finally, we'll look at how its current liabilities affect its ROCE.
Understanding Return On Capital Employed (ROCE)
ROCE is a metric for evaluating how much pre-tax income (in percentage terms) a company earns on the capital invested in its business. All else being equal, a better business will have a higher ROCE. Overall, it is a valuable metric that has its flaws. Author Edwin Whiting says to be careful when comparing the ROCE of different businesses, since 'No two businesses are exactly alike.'
So, How Do We Calculate ROCE?
The formula for calculating the return on capital employed is:
Return on Capital Employed = Earnings Before Interest and Tax (EBIT) ÷ (Total Assets - Current Liabilities)
Or for Momentum Group:
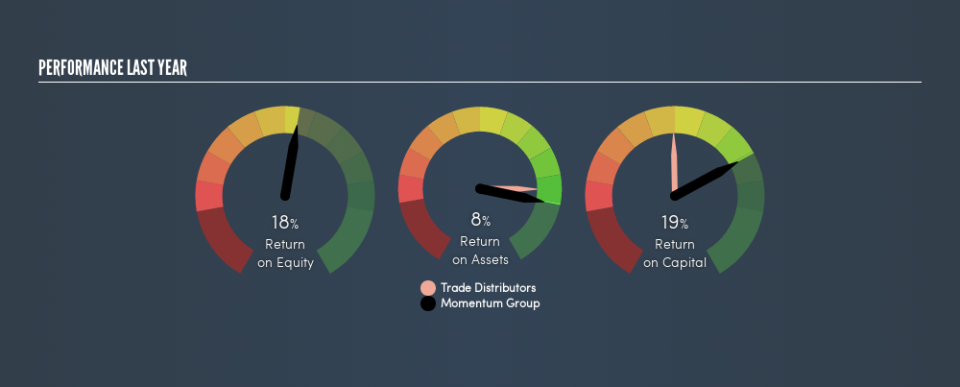
0.19 = kr302m ÷ (kr2.9b - kr1.4b) (Based on the trailing twelve months to March 2019.)
So, Momentum Group has an ROCE of 19%.
Want to participate in a short research study? Help shape the future of investing tools and you could win a $250 gift card!
Check out our latest analysis for Momentum Group
Does Momentum Group Have A Good ROCE?
When making comparisons between similar businesses, investors may find ROCE useful. In our analysis, Momentum Group's ROCE is meaningfully higher than the 14% average in the Trade Distributors industry. We would consider this a positive, as it suggests it is using capital more effectively than other similar companies. Putting aside its position relative to its industry for now, in absolute terms, Momentum Group's ROCE is currently very good.
As we can see, Momentum Group currently has an ROCE of 19% compared to its ROCE 3 years ago, which was 12%. This makes us wonder if the company is improving.
It is important to remember that ROCE shows past performance, and is not necessarily predictive. ROCE can be deceptive for cyclical businesses, as returns can look incredible in boom times, and terribly low in downturns. ROCE is only a point-in-time measure. Future performance is what matters, and you can see analyst predictions in our free report on analyst forecasts for the company.
Momentum Group's Current Liabilities And Their Impact On Its ROCE
Current liabilities include invoices, such as supplier payments, short-term debt, or a tax bill, that need to be paid within 12 months. Due to the way the ROCE equation works, having large bills due in the near term can make it look as though a company has less capital employed, and thus a higher ROCE than usual. To check the impact of this, we calculate if a company has high current liabilities relative to its total assets.
Momentum Group has total assets of kr2.9b and current liabilities of kr1.4b. As a result, its current liabilities are equal to approximately 47% of its total assets. Momentum Group's ROCE is boosted somewhat by its middling amount of current liabilities.
The Bottom Line On Momentum Group's ROCE
Even so, it has a great ROCE, and could be an attractive prospect for further research. Momentum Group looks strong on this analysis, but there are plenty of other companies that could be a good opportunity . Here is a free list of companies growing earnings rapidly.
If you like to buy stocks alongside management, then you might just love this free list of companies. (Hint: insiders have been buying them).
We aim to bring you long-term focused research analysis driven by fundamental data. Note that our analysis may not factor in the latest price-sensitive company announcements or qualitative material.
If you spot an error that warrants correction, please contact the editor at editorial-team@simplywallst.com. This article by Simply Wall St is general in nature. It does not constitute a recommendation to buy or sell any stock, and does not take account of your objectives, or your financial situation. Simply Wall St has no position in the stocks mentioned. Thank you for reading.
