Is There More To Anixter International Inc. (NYSE:AXE) Than Its 10% Returns On Capital?

Today we are going to look at Anixter International Inc. (NYSE:AXE) to see whether it might be an attractive investment prospect. Specifically, we'll consider its Return On Capital Employed (ROCE), since that will give us an insight into how efficiently the business can generate profits from the capital it requires.
First up, we'll look at what ROCE is and how we calculate it. Then we'll compare its ROCE to similar companies. Last but not least, we'll look at what impact its current liabilities have on its ROCE.
What is Return On Capital Employed (ROCE)?
ROCE measures the 'return' (pre-tax profit) a company generates from capital employed in its business. Generally speaking a higher ROCE is better. In brief, it is a useful tool, but it is not without drawbacks. Author Edwin Whiting says to be careful when comparing the ROCE of different businesses, since 'No two businesses are exactly alike.'
How Do You Calculate Return On Capital Employed?
Analysts use this formula to calculate return on capital employed:
Return on Capital Employed = Earnings Before Interest and Tax (EBIT) ÷ (Total Assets - Current Liabilities)
Or for Anixter International:
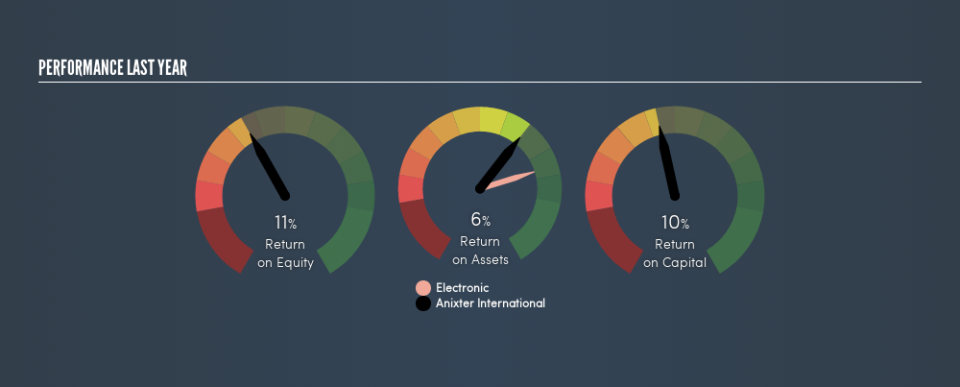
0.10 = US$354m ÷ (US$4.9b - US$1.5b) (Based on the trailing twelve months to June 2019.)
Therefore, Anixter International has an ROCE of 10%.
View our latest analysis for Anixter International
Does Anixter International Have A Good ROCE?
ROCE can be useful when making comparisons, such as between similar companies. Using our data, Anixter International's ROCE appears to be around the 12% average of the Electronic industry. Separate from how Anixter International stacks up against its industry, its ROCE in absolute terms is mediocre; relative to the returns on government bonds. It is possible that there are more rewarding investments out there.
You can click on the image below to see (in greater detail) how Anixter International's past growth compares to other companies.
It is important to remember that ROCE shows past performance, and is not necessarily predictive. ROCE can be misleading for companies in cyclical industries, with returns looking impressive during the boom times, but very weak during the busts. This is because ROCE only looks at one year, instead of considering returns across a whole cycle. Future performance is what matters, and you can see analyst predictions in our free report on analyst forecasts for the company.
How Anixter International's Current Liabilities Impact Its ROCE
Current liabilities are short term bills and invoices that need to be paid in 12 months or less. The ROCE equation subtracts current liabilities from capital employed, so a company with a lot of current liabilities appears to have less capital employed, and a higher ROCE than otherwise. To check the impact of this, we calculate if a company has high current liabilities relative to its total assets.
Anixter International has total assets of US$4.9b and current liabilities of US$1.5b. As a result, its current liabilities are equal to approximately 31% of its total assets. Anixter International's middling level of current liabilities have the effect of boosting its ROCE a bit.
The Bottom Line On Anixter International's ROCE
With this level of liabilities and a mediocre ROCE, there are potentially better investments out there. Of course, you might find a fantastic investment by looking at a few good candidates. So take a peek at this free list of companies with modest (or no) debt, trading on a P/E below 20.
I will like Anixter International better if I see some big insider buys. While we wait, check out this free list of growing companies with considerable, recent, insider buying.
We aim to bring you long-term focused research analysis driven by fundamental data. Note that our analysis may not factor in the latest price-sensitive company announcements or qualitative material.
If you spot an error that warrants correction, please contact the editor at editorial-team@simplywallst.com. This article by Simply Wall St is general in nature. It does not constitute a recommendation to buy or sell any stock, and does not take account of your objectives, or your financial situation. Simply Wall St has no position in the stocks mentioned. Thank you for reading.
