Is Morion Inc.’s (MCX:MORI) 13% Return On Capital Employed Good News?

Today we'll evaluate Morion Inc. (MCX:MORI) to determine whether it could have potential as an investment idea. In particular, we'll consider its Return On Capital Employed (ROCE), as that can give us insight into how profitably the company is able to employ capital in its business.
First, we'll go over how we calculate ROCE. Next, we'll compare it to others in its industry. Then we'll determine how its current liabilities are affecting its ROCE.
What is Return On Capital Employed (ROCE)?
ROCE is a measure of a company's yearly pre-tax profit (its return), relative to the capital employed in the business. All else being equal, a better business will have a higher ROCE. Ultimately, it is a useful but imperfect metric. Renowned investment researcher Michael Mauboussin has suggested that a high ROCE can indicate that 'one dollar invested in the company generates value of more than one dollar'.
How Do You Calculate Return On Capital Employed?
Analysts use this formula to calculate return on capital employed:
Return on Capital Employed = Earnings Before Interest and Tax (EBIT) ÷ (Total Assets - Current Liabilities)
Or for Morion:
0.13 = ₽179m ÷ (₽2.1b - ₽735m) (Based on the trailing twelve months to June 2019.)
So, Morion has an ROCE of 13%.
View our latest analysis for Morion
Is Morion's ROCE Good?
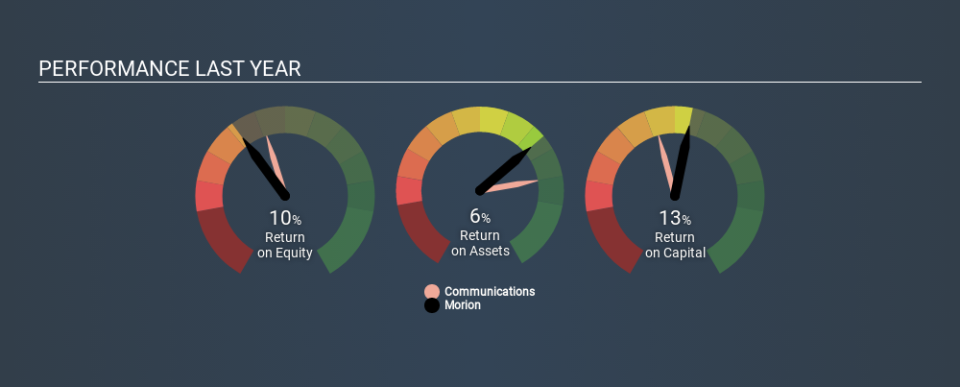
ROCE can be useful when making comparisons, such as between similar companies. We can see Morion's ROCE is around the 12% average reported by the Communications industry. Separate from how Morion stacks up against its industry, its ROCE in absolute terms is mediocre; relative to the returns on government bonds. It is possible that there are more rewarding investments out there.
We can see that, Morion currently has an ROCE of 13% compared to its ROCE 3 years ago, which was 10%. This makes us think about whether the company has been reinvesting shrewdly. You can click on the image below to see (in greater detail) how Morion's past growth compares to other companies.
When considering ROCE, bear in mind that it reflects the past and does not necessarily predict the future. ROCE can be deceptive for cyclical businesses, as returns can look incredible in boom times, and terribly low in downturns. ROCE is, after all, simply a snap shot of a single year. How cyclical is Morion? You can see for yourself by looking at this free graph of past earnings, revenue and cash flow.
How Morion's Current Liabilities Impact Its ROCE
Liabilities, such as supplier bills and bank overdrafts, are referred to as current liabilities if they need to be paid within 12 months. The ROCE equation subtracts current liabilities from capital employed, so a company with a lot of current liabilities appears to have less capital employed, and a higher ROCE than otherwise. To check the impact of this, we calculate if a company has high current liabilities relative to its total assets.
Morion has total assets of ₽2.1b and current liabilities of ₽735m. Therefore its current liabilities are equivalent to approximately 35% of its total assets. Morion's ROCE is improved somewhat by its moderate amount of current liabilities.
The Bottom Line On Morion's ROCE
Unfortunately, its ROCE is still uninspiring, and there are potentially more attractive prospects out there. But note: make sure you look for a great company, not just the first idea you come across. So take a peek at this free list of interesting companies with strong recent earnings growth (and a P/E ratio below 20).
I will like Morion better if I see some big insider buys. While we wait, check out this free list of growing companies with considerable, recent, insider buying.
If you spot an error that warrants correction, please contact the editor at editorial-team@simplywallst.com. This article by Simply Wall St is general in nature. It does not constitute a recommendation to buy or sell any stock, and does not take account of your objectives, or your financial situation. Simply Wall St has no position in the stocks mentioned.
We aim to bring you long-term focused research analysis driven by fundamental data. Note that our analysis may not factor in the latest price-sensitive company announcements or qualitative material. Thank you for reading.

