Most and Least Educated Cities in America

Education level can play an important role in the quality of life in your area. A larger percentage of people who have a degree or have attended a training program translates to a better workforce and a more vibrant local economy. What’s more, it can also be a sign that the public education system in the area is working well.
Watch Out: 30 Jobs That Aren’t Worth Their Education Requirements
GOBankingRates conducted a study to identify the most and least educated cities in America. The study determined what percentage of each age demographic had a degree and then used those numbers to determine which 25 American cities are among the best and worst educated. So, see if your city is among those that really understand how important education is.
Last updated: Dec. 4, 2020

Most Educated Cities
To identify the most educated cities, GOBankingRates took a number of metrics available through the Census Bureau’s American Community Survey — namely percentages of the local population ages 18-24 and 25 and older with less than a high school degree, a high school degree or its equivalent, some college or an associate degree, and a bachelor’s degree or higher.
Please note that each slide only contains data points for the 25 and older demographic. It allows for a clearer comparison of the numbers as they’re all from the same age group, and it accounts for the fact that many people will not have necessarily completed their education before their mid-20s.

25. Charleston, South Carolina
25 and older with a high school diploma: 17.6%
25 and older with some college or an associate degree: 25.1%
25 and older with a bachelor’s degree or higher: 52.1%
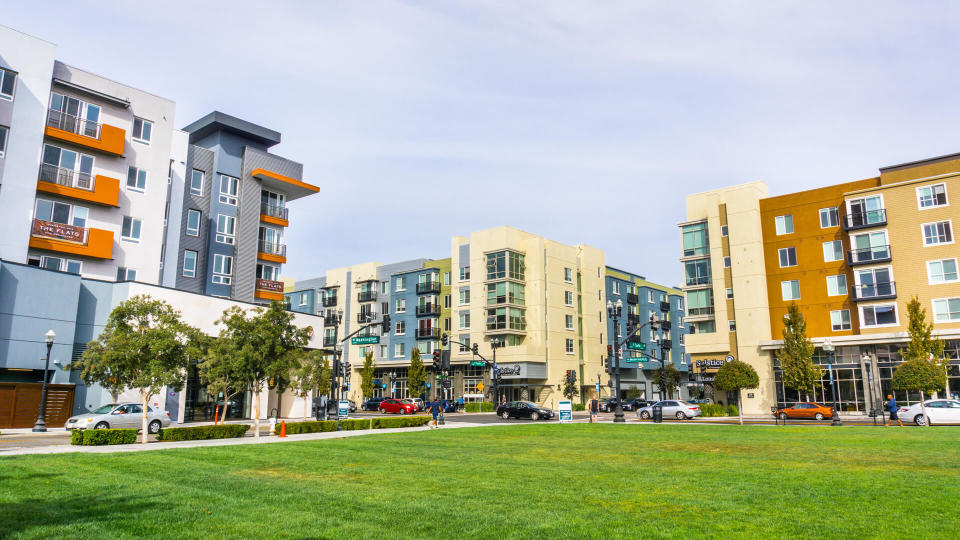
24. Sunnyvale, California
25 and older with a high school diploma: 10.8%
25 and older with some college or an associate degree: 17.8%
25 and older with a bachelor’s degree or higher: 63.7%

23. Washington, D.C.
25 and older with a high school diploma: 17.2%
25 and older with some college or an associate degree: 15.9%
25 and older with a bachelor’s degree or higher: 57.6%
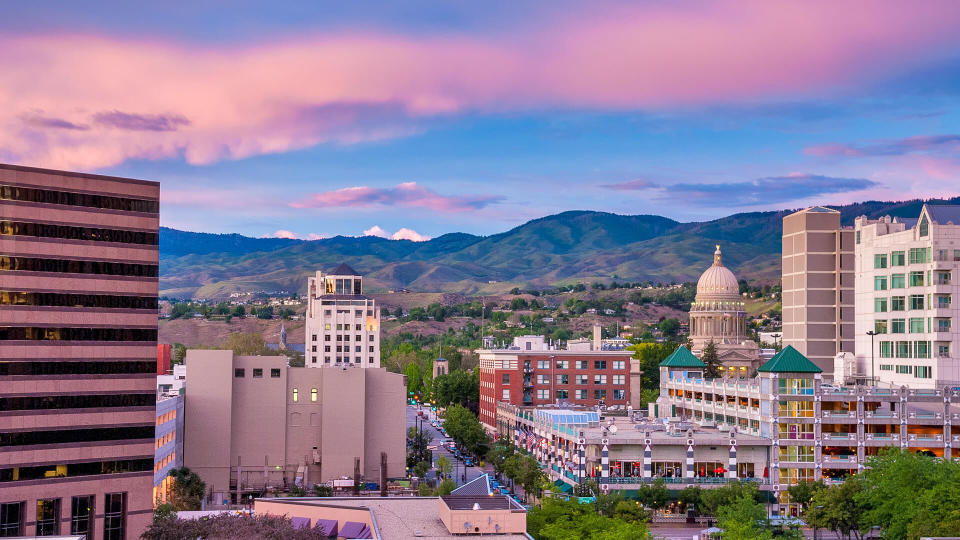
22. Boise, Idaho
25 and older with a high school diploma: 21.4%
25 and older with some college or an associate degree: 32.5%
25 and older with a bachelor’s degree or higher: 41.1%

21. Stamford, Connecticut
25 and older with a high school diploma: 12.5%
25 and older with some college or an associate degree: 20.8%
25 and older with a bachelor’s degree or higher: 62.2%
Find Out: 23 Safest School Reopenings Around the World and How They Did It
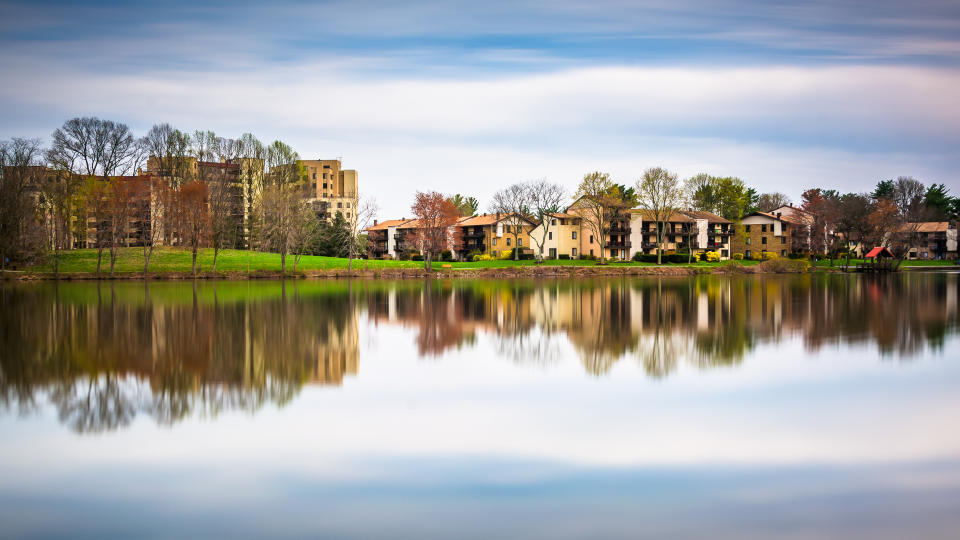
20. Columbia, Maryland
25 and older with a high school diploma: 12.5%
25 and older with some college or an associate degree: 20.8%
25 and older with a bachelor’s degree or higher: 62.2%
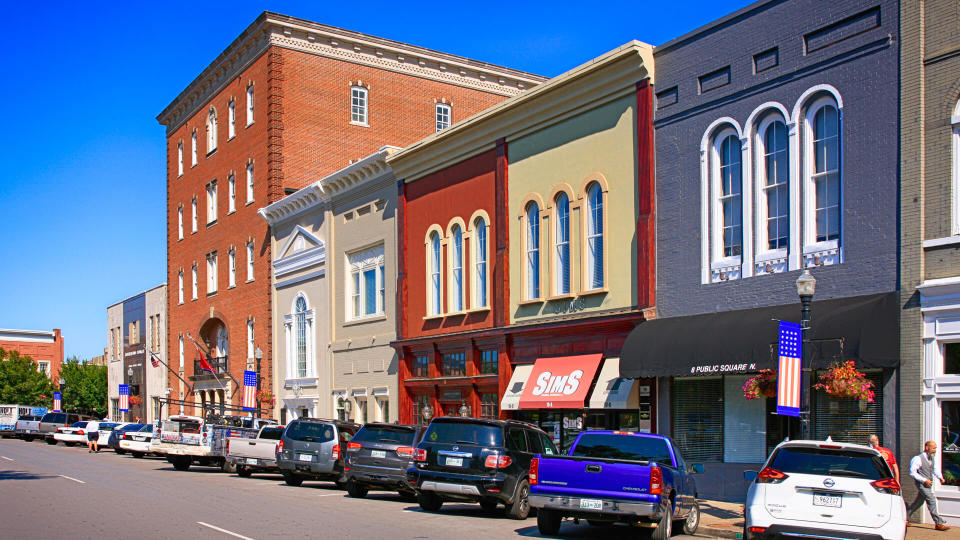
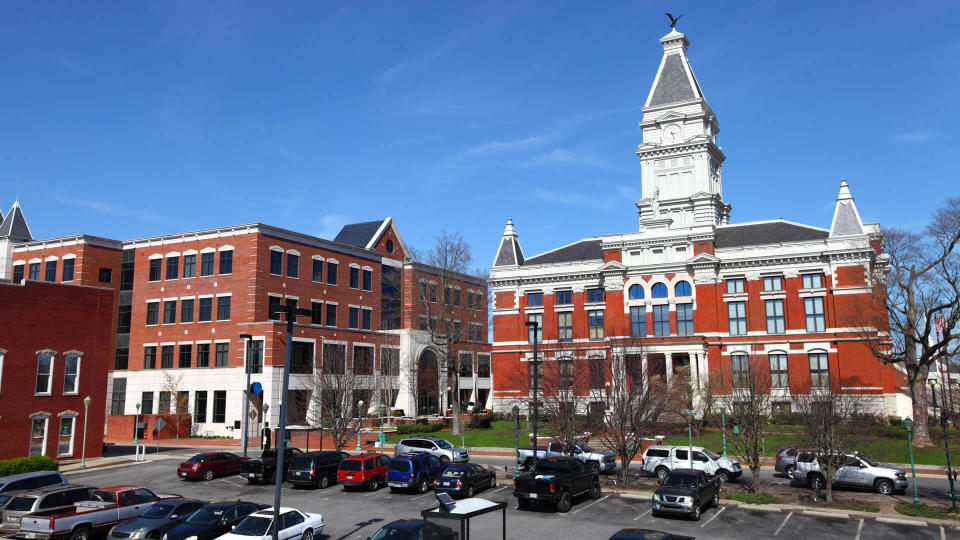
19. Murfreesboro, Tennessee
25 and older with a high school diploma: 20.3%
25 and older with some college or an associate degree: 19.1%
25 and older with a bachelor’s degree or higher: 49.7%

18. Bellevue, Washington
25 and older with a high school diploma: 9.2%
25 and older with some college or an associate degree: 18.7%
25 and older with a bachelor’s degree or higher: 67.6%
17. Clarksville, Tennessee
25 and older with a high school diploma: 28.0%
25 and older with some college or an associate degree: 38.1%
25 and older with a bachelor’s degree or higher: 26.5%

16. Fremont, California
25 and older with a high school diploma: 17.1%
25 and older with some college or an associate degree: 20.2%
25 and older with a bachelor’s degree or higher: 56.1%

15. San Francisco
25 and older with a high school diploma: 12.3%
25 and older with some college or an associate degree: 19.1%
25 and older with a bachelor’s degree or higher: 57.1%
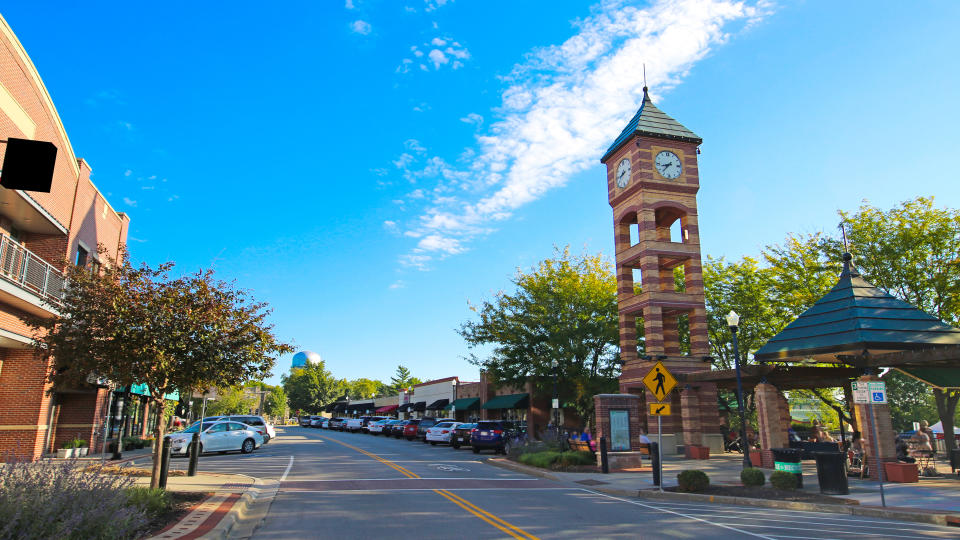
14. Overland Park, Kansas
25 and older with a high school diploma: 12.2%
25 and older with some college or an associate degree: 24.2%
25 and older with a bachelor’s degree or higher: 60.5%
Before You Go: The Most Expensive College in Every State
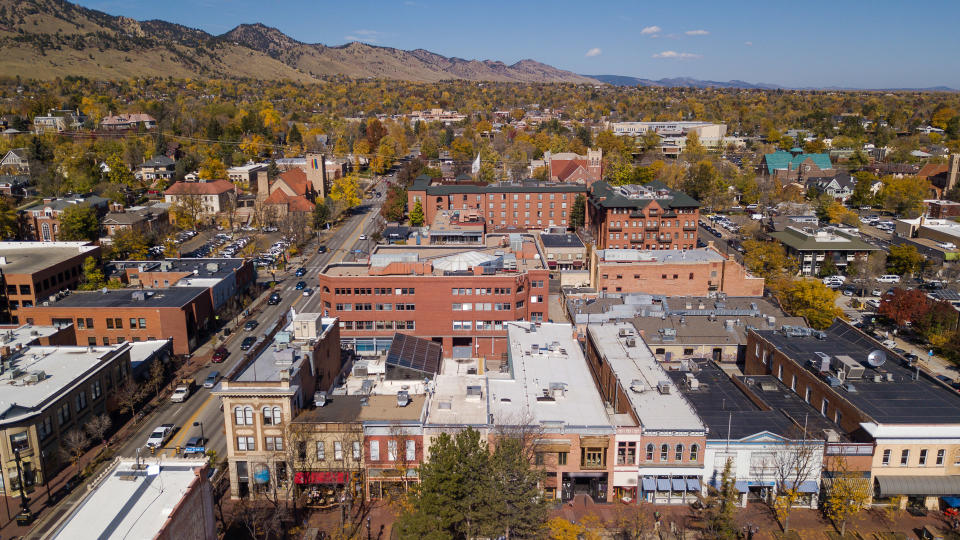
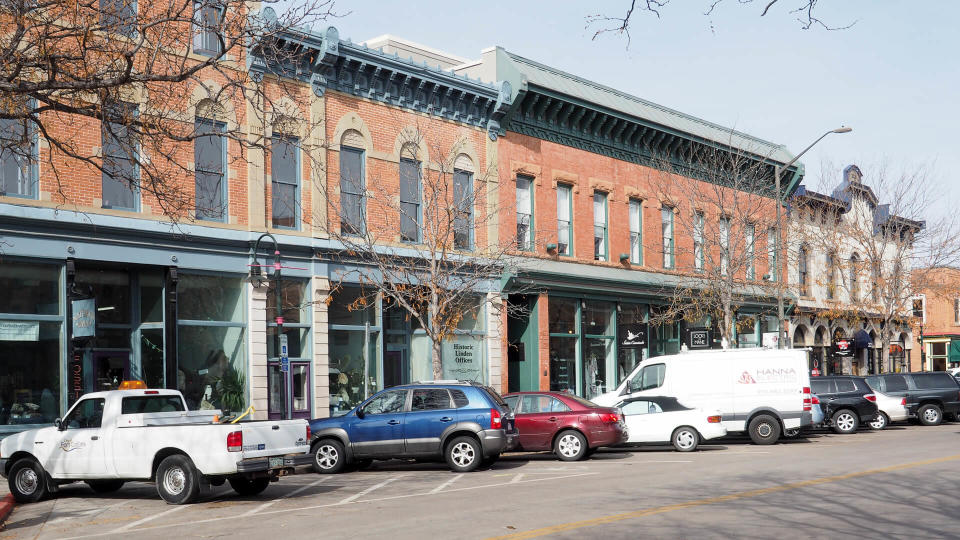
13. Boulder, Colorado
25 and older with a high school diploma: 6.7%
25 and older with some college or an associate degree: 15.9%
25 and older with a bachelor’s degree or higher: 73.9%

12. Sandy Springs, Georgia
25 and older with a high school diploma: 13.1%
25 and older with some college or an associate degree: 18.1%
25 and older with a bachelor’s degree or higher: 63.3%

11. Seattle
25 and older with a high school diploma: 9.8%
25 and older with some college or an associate degree: 22.0%
25 and older with a bachelor’s degree or higher: 62.8%

10. Santa Clara, California
25 and older with a high school diploma: 13.2%
25 and older with some college or an associate degree: 20.6%
25 and older with a bachelor’s degree or higher: 58.5%
9. Naperville, Illinois
25 and older with a high school diploma: 10.1%
25 and older with some college or an associate degree: 19.1%
25 and older with a bachelor’s degree or higher: 67.8%

8. Irvine, California
25 and older with a high school diploma: 8.0%
25 and older with some college or an associate degree: 19.8%
25 and older with a bachelor’s degree or higher: 68.6%

7. Pittsburgh
25 and older with a high school diploma: 26.2%
25 and older with some college or an associate degree: 23.3%
25 and older with a bachelor’s degree or higher: 43.0%
6. Fort Collins, Colorado
25 and older with a high school diploma: 14.9%
25 and older with some college or an associate degree: 27.1%
25 and older with a bachelor’s degree or higher: 54.5%
Things To Consider: Are These Pricey School Alternatives Worth It?
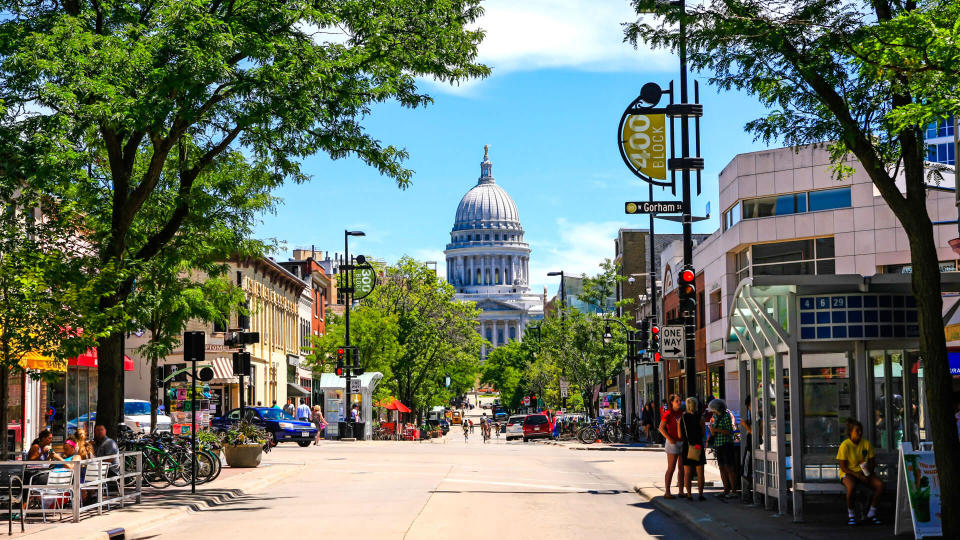
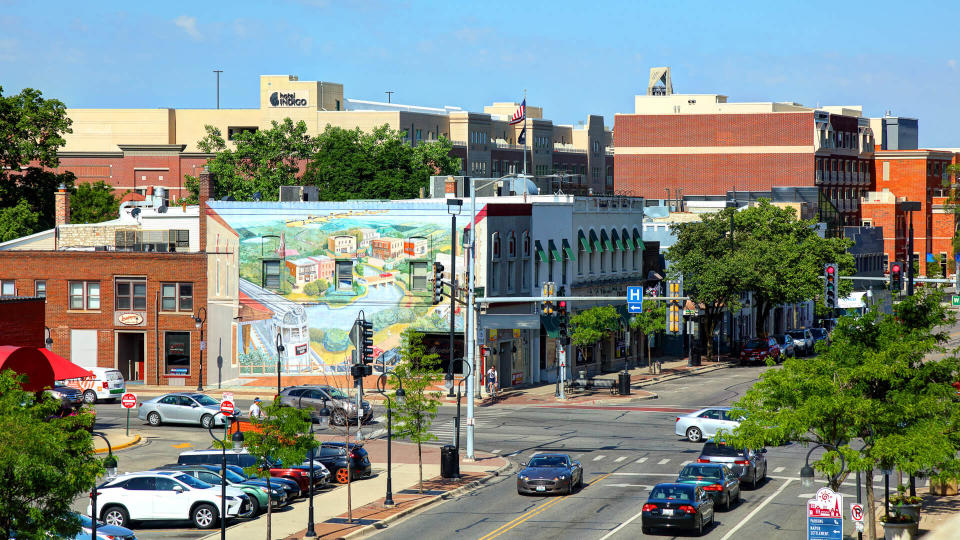
5. Madison, Wisconsin
25 and older with a high school diploma: 14.0%
25 and older with some college or an associate degree: 23.4%
25 and older with a bachelor’s degree or higher: 57.9%
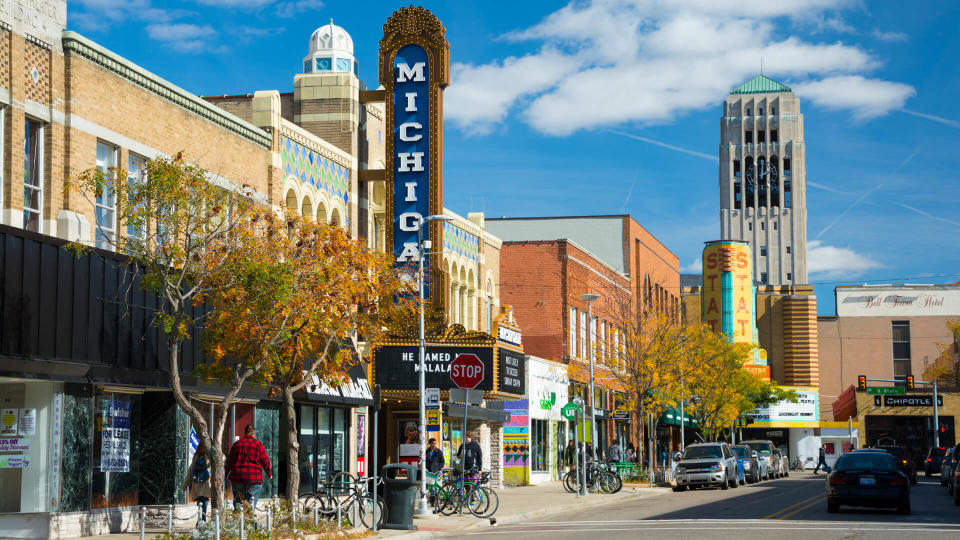
4. Ann Arbor, Michigan
25 and older with a high school diploma: 7.3%
25 and older with some college or an associate degree: 14.2%
25 and older with a bachelor’s degree or higher: 75.5%

3. Berkeley, California
25 and older with a high school diploma: 6.7%
25 and older with some college or an associate degree: 16.7%
25 and older with a bachelor’s degree or higher: 73.0%
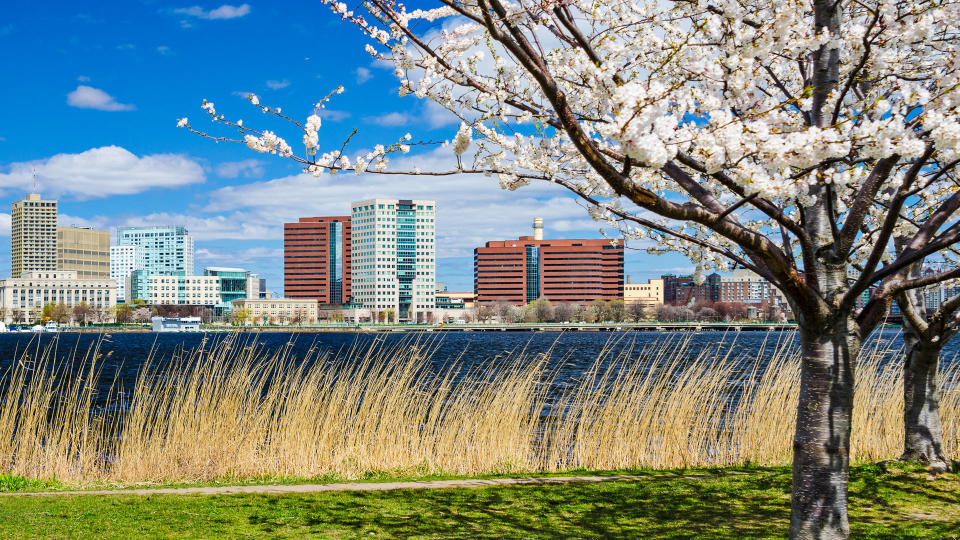
2. Cambridge, Massachusetts
25 and older with a high school diploma: 8.7%
25 and older with some college or an associate degree: 9.0%
25 and older with a bachelor’s degree or higher: 77.4%

1. Arlington, Virginia
25 and older with a high school diploma: 8.1%
25 and older with some college or an associate degree: 11.4%
25 and older with a bachelor’s degree or higher: 74.6%

Least Educated Cities
The methodology for the least educated cities is just the inverse of that for the most educated, using the same data set and methodology but focusing on the lowest-scoring cities.

25. Hialeah, Florida
25 and older with a high school diploma: 35.2%
25 and older with some college or an associate degree: 20.9%
25 and older with a bachelor’s degree or higher: 14.6%
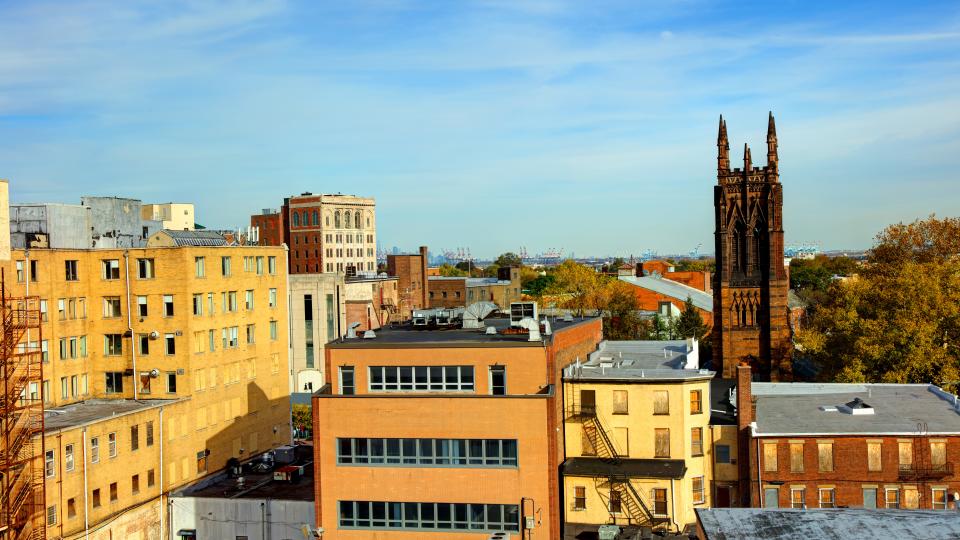
24. Elizabeth, New Jersey
25 and older with a high school diploma: 38.2%
25 and older with some college or an associate degree: 22.5%
25 and older with a bachelor’s degree or higher: 13.2%
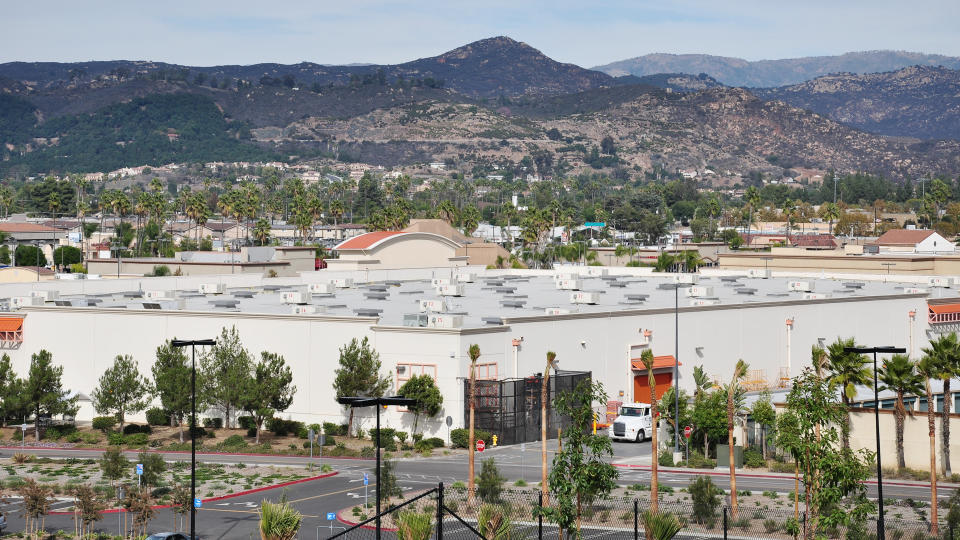
23. Escondido, California
25 and older with a high school diploma: 22.7%
25 and older with some college or an associate degree: 31.8%
25 and older with a bachelor’s degree or higher: 23.6%
Options: Most Affordable Private Colleges in Every State

22. Fresno, California
25 and older with a high school diploma: 22.6%
25 and older with some college or an associate degree: 32.5%
25 and older with a bachelor’s degree or higher: 21.6%
21. Rialto, California
25 and older with a high school diploma: 30.7%
25 and older with some college or an associate degree: 27.9%
25 and older with a bachelor’s degree or higher: 10.7%
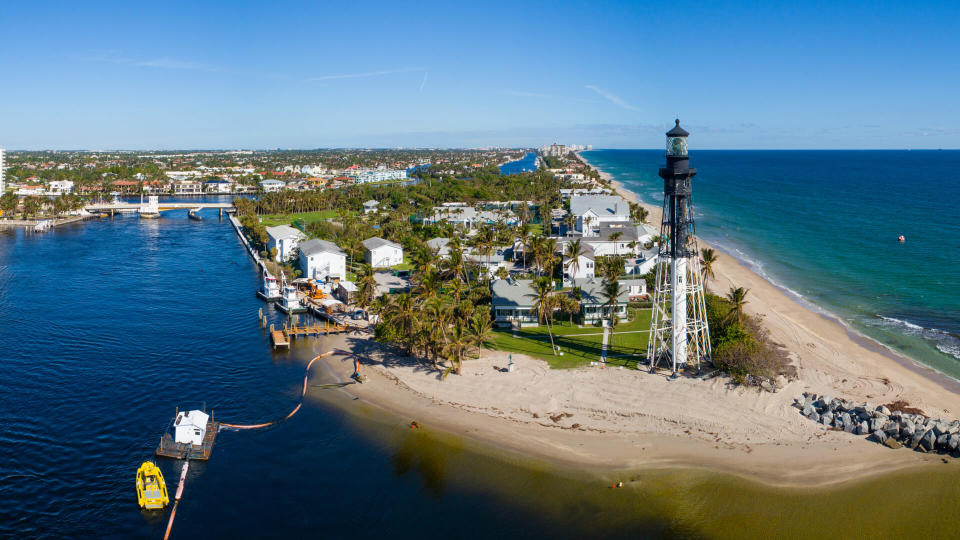
20. Pompano Beach, Florida
25 and older with a high school diploma: 31.3%
25 and older with some college or an associate degree: 27.4%
25 and older with a bachelor’s degree or higher: 24.1%
19. Pomona, California
25 and older with a high school diploma: 24.3%
25 and older with some college or an associate degree: 26.7%
25 and older with a bachelor’s degree or higher: 17.8%

18. Hartford, Connecticut
25 and older with a high school diploma: 33.6%
25 and older with some college or an associate degree: 23.8%
25 and older with a bachelor’s degree or higher: 16.8%
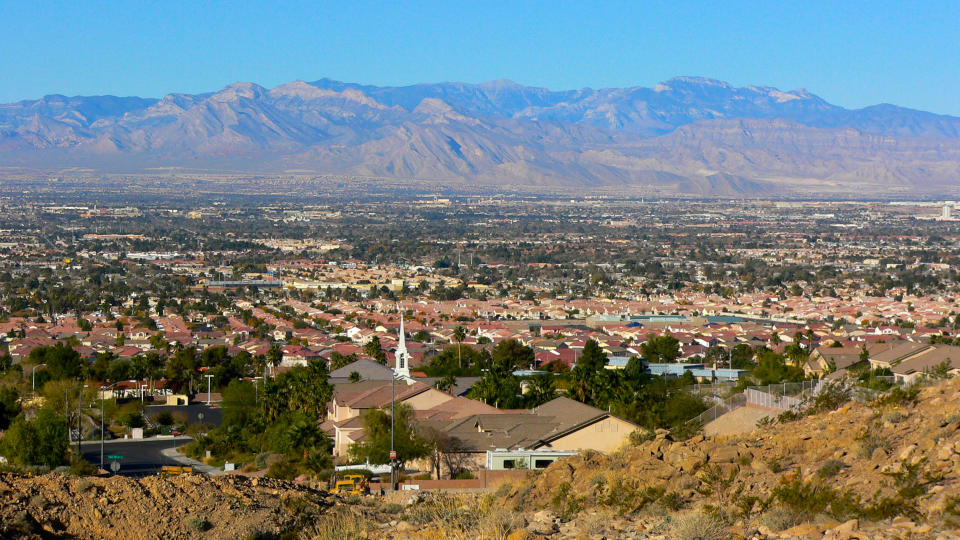
17. Sunrise Manor, Nevada
25 and older with a high school diploma: 33.7%
25 and older with some college or an associate degree: 28.4%
25 and older with a bachelor’s degree or higher: 10.6%
16. Inglewood, California
25 and older with a high school diploma: 21.1%
25 and older with some college or an associate degree: 34.1%
25 and older with a bachelor’s degree or higher: 20.5%
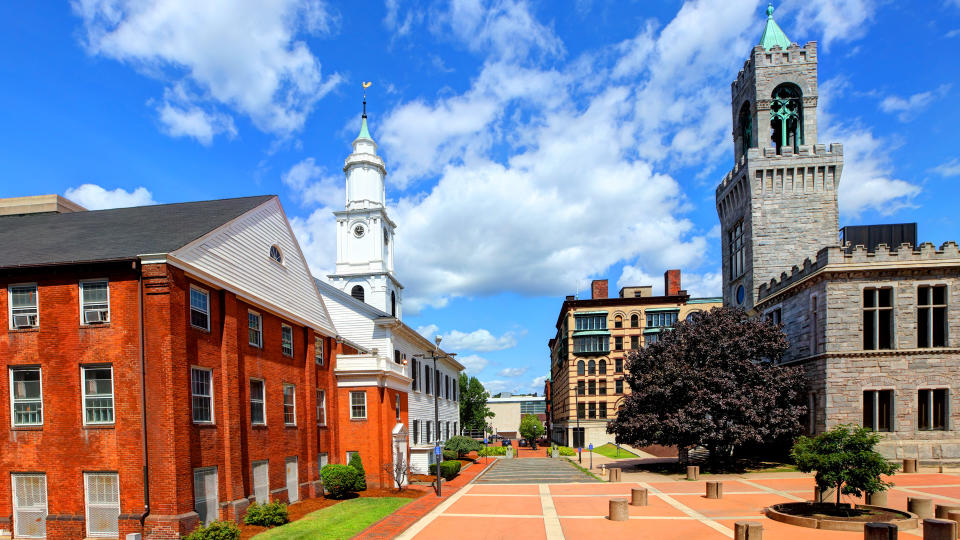
15. Springfield, Massachusetts
25 and older with a high school diploma: 31.4%
25 and older with some college or an associate degree: 27.3%
25 and older with a bachelor’s degree or higher: 18.6%

14. Pasadena, Texas
25 and older with a high school diploma: 30.9%
25 and older with some college or an associate degree: 26.5%
25 and older with a bachelor’s degree or higher: 14.2%
13. Kansas City, Kansas
25 and older with a high school diploma: 32.4%
25 and older with some college or an associate degree: 28.9%
25 and older with a bachelor’s degree or higher: 17.2%

12. Lehigh Acres, Florida
25 and older with a high school diploma: 36.9%
25 and older with some college or an associate degree: 29.3%
25 and older with a bachelor’s degree or higher: 13.6%
Check Out: The Best Colleges With Tuition Under $20K

11. San Bernardino, California
25 and older with a high school diploma: 28.3%
25 and older with some college or an associate degree: 28.4%
25 and older with a bachelor’s degree or higher: 11.7%
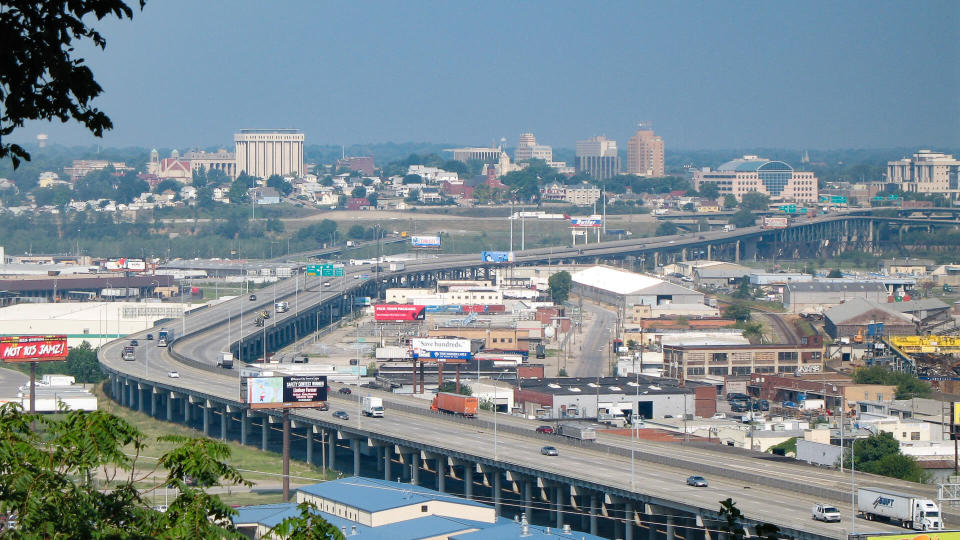
10. McAllen, Texas
25 and older with a high school diploma: 19.1%
25 and older with some college or an associate degree: 25.8%
25 and older with a bachelor’s degree or higher: 30.4%
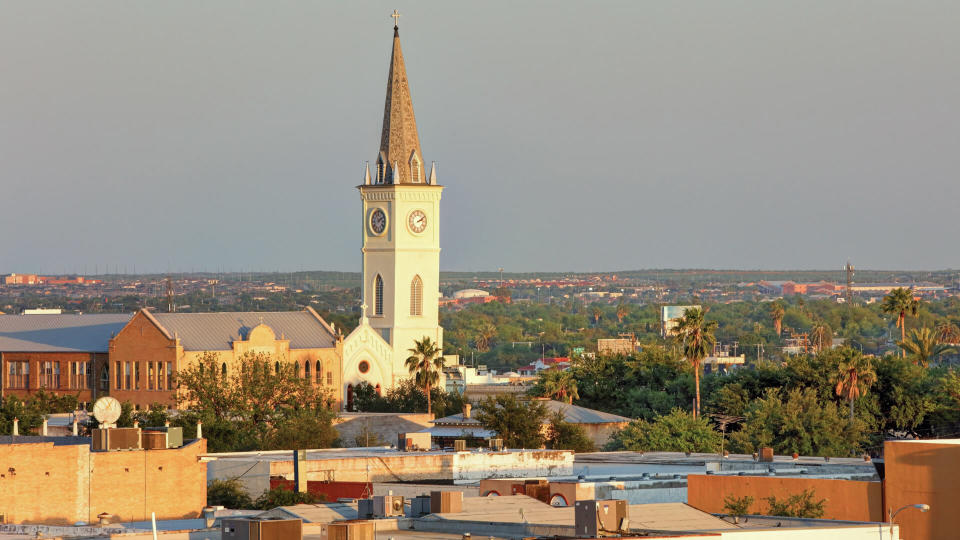
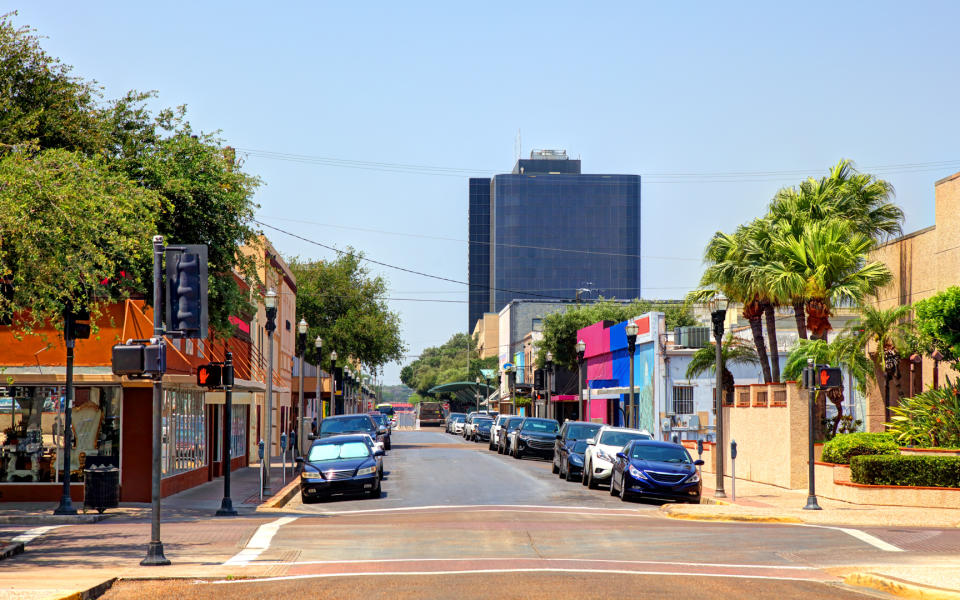
9. Laredo, Texas
25 and older with a high school diploma: 26.4%
25 and older with some college or an associate degree: 23.0%
25 and older with a bachelor’s degree or higher: 18.9%
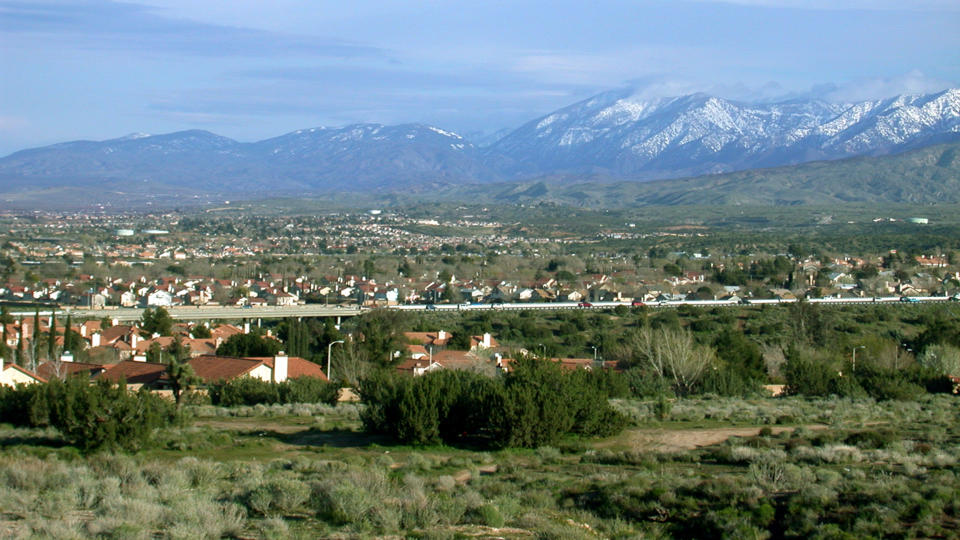
8. Palmdale, California
25 and older with a high school diploma: 25.3%
25 and older with some college or an associate degree: 33.5%
25 and older with a bachelor’s degree or higher: 15.0%

7. Oxnard, California
25 and older with a high school diploma: 23.0%
25 and older with some college or an associate degree: 28.7%
25 and older with a bachelor’s degree or higher: 17.2%

6. Santa Ana, California
25 and older with a high school diploma: 22.3%
25 and older with some college or an associate degree: 22.0%
25 and older with a bachelor’s degree or higher: 14.0%

5. Brownsville, Texas
25 and older with a high school diploma: 23.4%
25 and older with some college or an associate degree: 22.1%
25 and older with a bachelor’s degree or higher: 18.9%

4. El Monte, California
25 and older with a high school diploma: 26.7%
25 and older with some college or an associate degree: 19.5%
25 and older with a bachelor’s degree or higher: 11.7%
3. Salinas, California
25 and older with a high school diploma: 22.3%
25 and older with some college or an associate degree: 23.4%
25 and older with a bachelor’s degree or higher: 13.3%

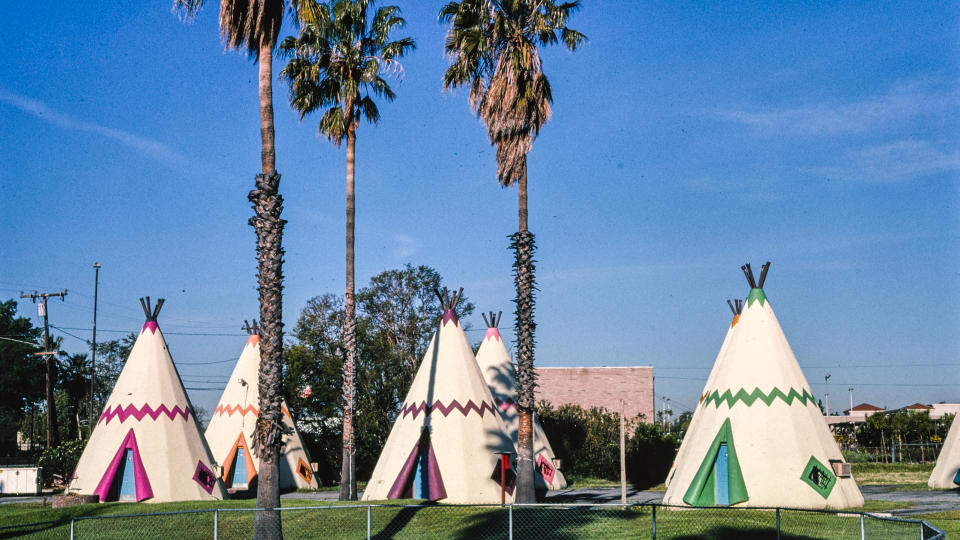
2. Santa Maria, California
25 and older with a high school diploma: 19.7%
25 and older with some college or an associate degree: 26.5%
25 and older with a bachelor’s degree or higher: 13.4%
1. East Los Angeles, California
25 and older with a high school diploma: 23.3%
25 and older with some college or an associate degree: 19.8%
25 and older with a bachelor’s degree or higher: 8.3%
More From GOBankingRates
Are You Spending More Than the Average American on 25 Everyday Items?
Guns and 32 Other Things You Definitely Do NOT Need To Buy During the Coronavirus Pandemic
Methodology: GOBankingRates analyzed every city in America with a population greater than 100,000 according to the 2018 United States Census Bureau’s American Community Survey to find the most and least educated cities in the country. Using the 2018 ACS, GOBankingRates found the following factors for each city: (1) the percent of 18- to 24-year-olds with less than a high school degree; (2) the percent of residents 25 and older with less than a high school degree; (3) the percent of 18- to 24-year-olds with a high school degree or equivalent; (4) the percent of residents 25 and older with a high school degree or equivalent; (5) the percent of 18- to 24-year-olds with some college or an associate’s degree; (6) the percent of residents 25 and older with some college or an Associate’s degree; (7) the percent of 18- to 24-year-olds with a bachelor’s degree or higher; and (8) the percent of residents 25 and older with a bachelor’s degree or higher. These eight factors were then scored and combined to give a final ranking. A lower percentage of residents in categories (1) and (2) and a higher percentage of residents in categories (3) through (8) were considered indicators that a city was more highly educated. In the final calculation of scores, factors (5) and (6) carried half as much weight as other factors and factors (7) and (8) were weighted twice as heavily as other factors. For the cities listed in the final rankings, supplemental data was provided on the unemployment rate, annual median earnings for residents 16 years and older with earnings and the typical home value in August 2020. Unemployment and earnings data were sourced from the 2018 ACS and the typical home value was sourced from Zillow. All research was conducted on and up to date as of Sept. 16, 2020.
This article originally appeared on GOBankingRates.com: Most and Least Educated Cities in America

