What Is Mostotrest's (MCX:MSTT) P/E Ratio After Its Share Price Rocketed?

Mostotrest (MCX:MSTT) shares have continued recent momentum with a 31% gain in the last month alone. The full year gain of 40% is pretty reasonable, too.
All else being equal, a sharp share price increase should make a stock less attractive to potential investors. In the long term, share prices tend to follow earnings per share, but in the short term prices bounce around in response to short term factors (which are not always obvious). The implication here is that deep value investors might steer clear when expectations of a company are too high. One way to gauge market expectations of a stock is to look at its Price to Earnings Ratio (PE Ratio). Investors have optimistic expectations of companies with higher P/E ratios, compared to companies with lower P/E ratios.
Check out our latest analysis for Mostotrest
Does Mostotrest Have A Relatively High Or Low P/E For Its Industry?
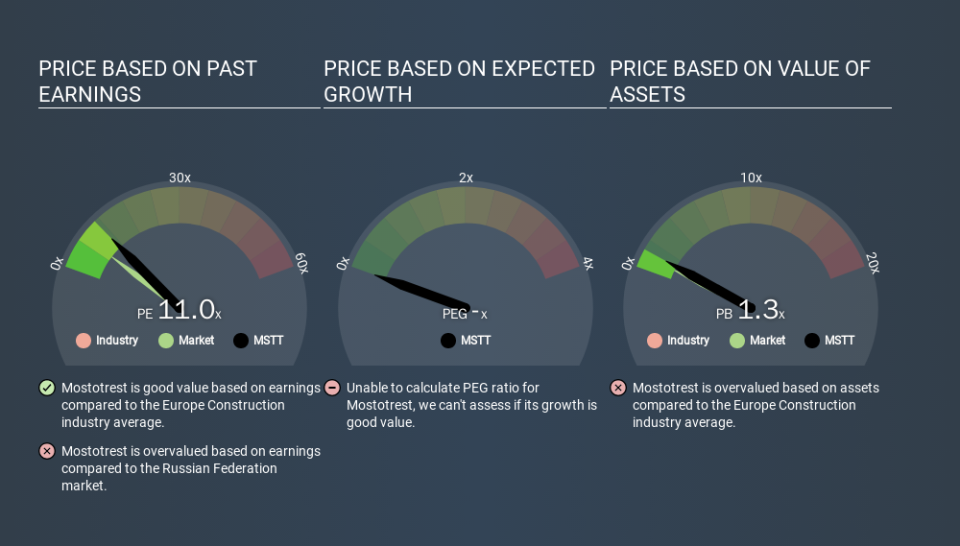
Mostotrest has a P/E ratio of 11.01. As you can see below Mostotrest has a P/E ratio that is fairly close for the average for the construction industry, which is 11.1.
That indicates that the market expects Mostotrest will perform roughly in line with other companies in its industry. The company could surprise by performing better than average, in the future. Further research into factors such as insider buying and selling, could help you form your own view on whether that is likely.
How Growth Rates Impact P/E Ratios
If earnings fall then in the future the 'E' will be lower. That means even if the current P/E is low, it will increase over time if the share price stays flat. Then, a higher P/E might scare off shareholders, pushing the share price down.
In the last year, Mostotrest grew EPS like Taylor Swift grew her fan base back in 2010; the 282% gain was both fast and well deserved. Regrettably, the longer term performance is poor, with EPS down -6.2% per year over 3 years.
Don't Forget: The P/E Does Not Account For Debt or Bank Deposits
One drawback of using a P/E ratio is that it considers market capitalization, but not the balance sheet. So it won't reflect the advantage of cash, or disadvantage of debt. Theoretically, a business can improve its earnings (and produce a lower P/E in the future) by investing in growth. That means taking on debt (or spending its cash).
Such spending might be good or bad, overall, but the key point here is that you need to look at debt to understand the P/E ratio in context.
So What Does Mostotrest's Balance Sheet Tell Us?
Net debt totals a substantial 151% of Mostotrest's market cap. If you want to compare its P/E ratio to other companies, you must keep in mind that these debt levels would usually warrant a relatively low P/E.
The Verdict On Mostotrest's P/E Ratio
Mostotrest trades on a P/E ratio of 11.0, which is above its market average of 7.3. Its meaningful level of debt should warrant a lower P/E ratio, but the fast EPS growth is a positive. So despite the debt it is, perhaps, not unreasonable to see a high P/E ratio. What is very clear is that the market has become more optimistic about Mostotrest over the last month, with the P/E ratio rising from 8.4 back then to 11.0 today. If you like to buy stocks that have recently impressed the market, then this one might be a candidate; but if you prefer to invest when there is 'blood in the streets', then you may feel the opportunity has passed.
When the market is wrong about a stock, it gives savvy investors an opportunity. As value investor Benjamin Graham famously said, 'In the short run, the market is a voting machine but in the long run, it is a weighing machine. We don't have analyst forecasts, but you might want to assess this data-rich visualization of earnings, revenue and cash flow.
Of course you might be able to find a better stock than Mostotrest. So you may wish to see this free collection of other companies that have grown earnings strongly.
If you spot an error that warrants correction, please contact the editor at editorial-team@simplywallst.com. This article by Simply Wall St is general in nature. It does not constitute a recommendation to buy or sell any stock, and does not take account of your objectives, or your financial situation. Simply Wall St has no position in the stocks mentioned.
We aim to bring you long-term focused research analysis driven by fundamental data. Note that our analysis may not factor in the latest price-sensitive company announcements or qualitative material. Thank you for reading.

