How Much Of Graph Blockchain Inc. (CNSX:GBLC) Do Insiders Own?

Every investor in Graph Blockchain Inc. (CNSX:GBLC) should be aware of the most powerful shareholder groups. Institutions often own shares in more established companies, while it's not unusual to see insiders own a fair bit of smaller companies. I generally like to see some degree of insider ownership, even if only a little. As Nassim Nicholas Taleb said, 'Don’t tell me what you think, tell me what you have in your portfolio.'
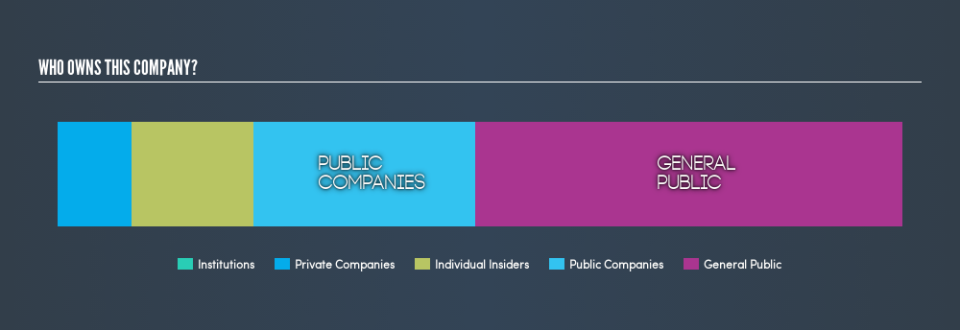
With a market capitalization of CA$4.1m, Graph Blockchain is a small cap stock, so it might not be well known by many institutional investors. Taking a look at our data on the ownership groups (below), it's seems that institutional investors have not yet purchased shares. Let's take a closer look to see what the different types of shareholder can tell us about GBLC.
Want to participate in a short research study? Help shape the future of investing tools and you could win a $250 gift card!
See our latest analysis for Graph Blockchain
What Does The Lack Of Institutional Ownership Tell Us About Graph Blockchain?
Institutional investors often avoid companies that are too small, too illiquid or too risky for their tastes. But it's unusual to see larger companies without any institutional investors.
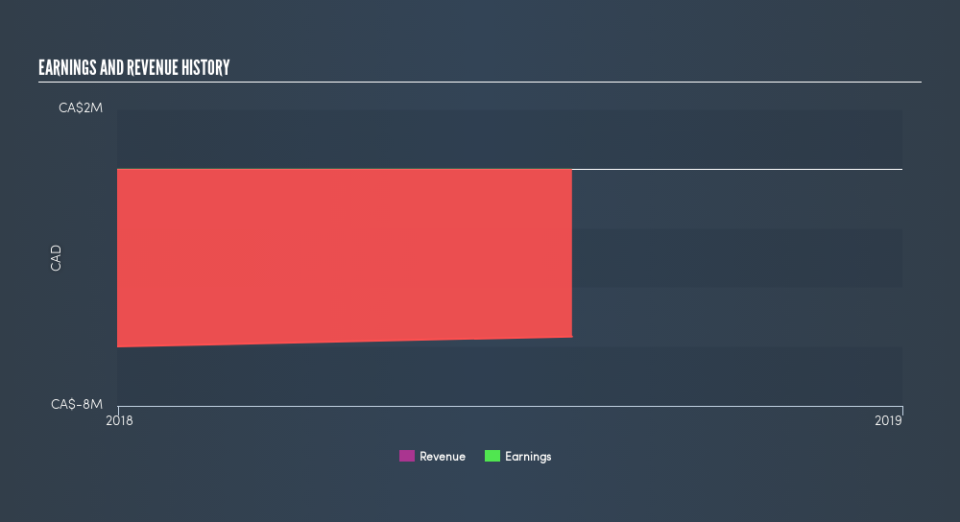
There are multiple explanations for why institutions don't own a stock. The most common is that the company is too small relative to fund under management, so the institition does not bother to look closely at the company. It is also possible that fund managers don't own the stock because they aren't convinced it will perform well. Graph Blockchain's earnings and revenue track record (below) may not be compelling to institutional investors -- or they simply might not have looked at the business closely.
Graph Blockchain is not owned by hedge funds. As far I can tell there isn't analyst coverage of the company, so it is probably flying under the radar.
Insider Ownership Of Graph Blockchain
The definition of company insiders can be subjective, and does vary between jurisdictions. Our data reflects individual insiders, capturing board members at the very least. Management ultimately answers to the board. However, it is not uncommon for managers to be executive board members, especially if they are a founder or the CEO.
I generally consider insider ownership to be a good thing. However, on some occasions it makes it more difficult for other shareholders to hold the board accountable for decisions.
Our most recent data indicates that insiders own a reasonable proportion of Graph Blockchain Inc.. It has a market capitalization of just CA$4.1m, and insiders have CA$598k worth of shares in their own names. This may suggest that the founders still own a lot of shares. You can click here to see if they have been buying or selling.
General Public Ownership
The general public, mostly retail investors, hold a substantial 50% stake in GBLC, suggesting it is a fairly popular stock. This level of ownership gives retail investors the power to sway key policy decisions such as board composition, executive compensation, and the dividend payout ratio.
Private Company Ownership
Our data indicates that Private Companies hold 8.8%, of the company's shares. It's hard to draw any conclusions from this fact alone, so its worth looking into who owns those private companies. Sometimes insiders or other related parties have an interest in shares in a public company through a separate private company.
Public Company Ownership
Public companies currently own 26% of GBLC stock. We can't be certain, but this is quite possible this is a strategic stake. The businesses may be similar, or work together.
Next Steps:
It's always worth thinking about the different groups who own shares in a company. But to understand Graph Blockchain better, we need to consider many other factors.
I always like to check for a history of revenue growth. You can too, by accessing this free chart of historic revenue and earnings in this detailed graph.
If you would prefer check out another company -- one with potentially superior financials -- then do not miss this free list of interesting companies, backed by strong financial data.
NB: Figures in this article are calculated using data from the last twelve months, which refer to the 12-month period ending on the last date of the month the financial statement is dated. This may not be consistent with full year annual report figures.
We aim to bring you long-term focused research analysis driven by fundamental data. Note that our analysis may not factor in the latest price-sensitive company announcements or qualitative material.
If you spot an error that warrants correction, please contact the editor at editorial-team@simplywallst.com. This article by Simply Wall St is general in nature. It does not constitute a recommendation to buy or sell any stock, and does not take account of your objectives, or your financial situation. Simply Wall St has no position in the stocks mentioned. Thank you for reading.
