How Much Of Lifespot Health Ltd (ASX:LSH) Do Institutions Own?

A look at the shareholders of Lifespot Health Ltd (ASX:LSH) can tell us which group is most powerful. Institutions will often hold stock in bigger companies, and we expect to see insiders owning a noticeable percentage of the smaller ones. We also tend to see lower insider ownership in companies that were previously publicly owned.
With a market capitalization of AU$4.9m, Lifespot Health is a small cap stock, so it might not be well known by many institutional investors. Our analysis of the ownership of the company, below, shows that institutional investors have bought into the company. Let's delve deeper into each type of owner, to discover more about LSH.
See our latest analysis for Lifespot Health
What Does The Institutional Ownership Tell Us About Lifespot Health?
Many institutions measure their performance against an index that approximates the local market. So they usually pay more attention to companies that are included in major indices.
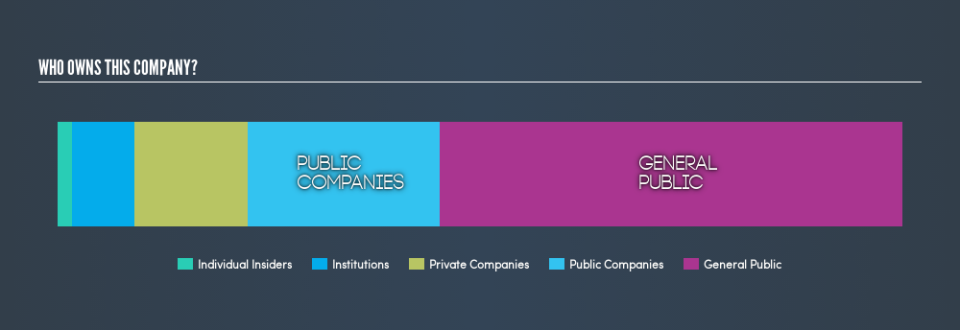
As you can see, institutional investors own 7.3% of Lifespot Health. This implies the analysts working for those institutions have looked at the stock and they like it. But just like anyone else, they could be wrong. When multiple institutions own a stock, there's always a risk that they are in a 'crowded trade'. When such a trade goes wrong, multiple parties may compete to sell stock fast. This risk is higher in a company without a history of growth. You can see Lifespot Health's historic earnings and revenue, below, but keep in mind there's always more to the story.

Hedge funds don't have many shares in Lifespot Health. As far I can tell there isn't analyst coverage of the company, so it is probably flying under the radar.
Insider Ownership Of Lifespot Health
The definition of company insiders can be subjective, and does vary between jurisdictions. Our data reflects individual insiders, capturing board members at the very least. Company management run the business, but the CEO will answer to the board, even if he or she is a member of it.
Most consider insider ownership a positive because it can indicate the board is well aligned with other shareholders. However, on some occasions too much power is concentrated within this group.
Our most recent data indicates that insiders own some shares in Lifespot Health Ltd. In their own names, insiders own AU$90k worth of stock in the AU$4.9m company. Some would say this shows alignment of interests between shareholders and the board, though I generally prefer to see bigger insider holdings. But it might be worth checking if those insiders have been selling.
General Public Ownership
The general public, mostly retail investors, hold a substantial 55% stake in LSH, suggesting it is a fairly popular stock. This level of ownership gives retail investors the power to sway key policy decisions such as board composition, executive compensation, and the dividend payout ratio.
Private Company Ownership
It seems that Private Companies own 13%, of the LSH stock. It might be worth looking deeper into this. If related parties, such as insiders, have an interest in one of these private companies, that should be disclosed in the annual report. Private companies may also have a strategic interest in the company.
Public Company Ownership
Public companies currently own 23% of LSH stock. We can't be certain, but this is quite possible this is a strategic stake. The businesses may be similar, or work together.
Next Steps:
While it is well worth considering the different groups that own a company, there are other factors that are even more important.
I always like to check for a history of revenue growth. You can too, by accessing this free chart of historic revenue and earnings in this detailed graph.
Of course this may not be the best stock to buy. So take a peek at this free free list of interesting companies.
NB: Figures in this article are calculated using data from the last twelve months, which refer to the 12-month period ending on the last date of the month the financial statement is dated. This may not be consistent with full year annual report figures.
We aim to bring you long-term focused research analysis driven by fundamental data. Note that our analysis may not factor in the latest price-sensitive company announcements or qualitative material.
If you spot an error that warrants correction, please contact the editor at editorial-team@simplywallst.com. This article by Simply Wall St is general in nature. It does not constitute a recommendation to buy or sell any stock, and does not take account of your objectives, or your financial situation. Simply Wall St has no position in the stocks mentioned. Thank you for reading.
