What You Must Know About Sandvik AB's (STO:SAND) Financial Strength

The size of Sandvik AB (STO:SAND), a kr213b large-cap, often attracts investors seeking a reliable investment in the stock market. Risk-averse investors who are attracted to diversified streams of revenue and strong capital returns tend to seek out these large companies. But, the key to their continued success lies in its financial health. Let’s take a look at Sandvik’s leverage and assess its financial strength to get an idea of their ability to fund strategic acquisitions and grow through cyclical pressures. Note that this information is centred entirely on financial health and is a high-level overview, so I encourage you to look further into SAND here.
See our latest analysis for Sandvik
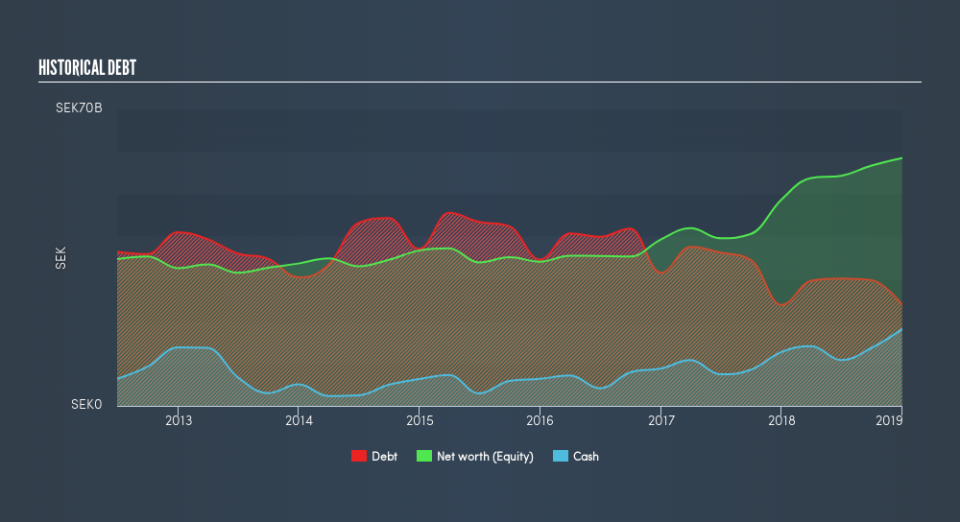
Does SAND Produce Much Cash Relative To Its Debt?
Over the past year, SAND has maintained its debt levels at around kr24b – this includes long-term debt. At this stable level of debt, SAND currently has kr18b remaining in cash and short-term investments to keep the business going. Additionally, SAND has produced cash from operations of kr15b over the same time period, leading to an operating cash to total debt ratio of 62%, signalling that SAND’s current level of operating cash is high enough to cover debt.
Can SAND pay its short-term liabilities?
With current liabilities at kr27b, it seems that the business has been able to meet these commitments with a current assets level of kr65b, leading to a 2.43x current account ratio. The current ratio is calculated by dividing current assets by current liabilities. For Machinery companies, this ratio is within a sensible range since there's a sufficient cash cushion without leaving too much capital idle or in low-earning investments.
Can SAND service its debt comfortably?
With a debt-to-equity ratio of 41%, SAND can be considered as an above-average leveraged company. This isn’t uncommon for large companies because interest payments on debt are tax deductible, meaning debt can be a cheaper source of capital than equity. Accordingly, large companies often have an advantage over small-caps through lower cost of capital due to cheaper financing. The sustainability of SAND’s debt levels can be assessed by comparing the company’s interest payments to earnings. As a rule of thumb, a company should have earnings before interest and tax (EBIT) of at least three times the size of net interest. In SAND's case, the ratio of 20.69x suggests that interest is amply covered. High interest coverage is seen as a responsible and safe practice, which highlights why most investors believe large-caps such as SAND is a safe investment.
Next Steps:
Although SAND’s debt level is towards the higher end of the spectrum, its cash flow coverage seems adequate to meet obligations which means its debt is being efficiently utilised. Since there is also no concerns around SAND's liquidity needs, this may be its optimal capital structure for the time being. Keep in mind I haven't considered other factors such as how SAND has been performing in the past. I suggest you continue to research Sandvik to get a more holistic view of the large-cap by looking at:
Future Outlook: What are well-informed industry analysts predicting for SAND’s future growth? Take a look at our free research report of analyst consensus for SAND’s outlook.
Valuation: What is SAND worth today? Is the stock undervalued, even when its growth outlook is factored into its intrinsic value? The intrinsic value infographic in our free research report helps visualize whether SAND is currently mispriced by the market.
Other High-Performing Stocks: Are there other stocks that provide better prospects with proven track records? Explore our free list of these great stocks here.
We aim to bring you long-term focused research analysis driven by fundamental data. Note that our analysis may not factor in the latest price-sensitive company announcements or qualitative material.
If you spot an error that warrants correction, please contact the editor at editorial-team@simplywallst.com. This article by Simply Wall St is general in nature. It does not constitute a recommendation to buy or sell any stock, and does not take account of your objectives, or your financial situation. Simply Wall St has no position in the stocks mentioned. Thank you for reading.

