What You Must Know About Sinopharm Group Co. Ltd.'s (HKG:1099) Financial Strength

Investors pursuing a solid, dependable stock investment can often be led to Sinopharm Group Co. Ltd. (HKG:1099), a large-cap worth HK$96b. One reason being its ‘too big to fail’ aura which gives it the appearance of a strong and stable investment. But, the key to their continued success lies in its financial health. This article will examine Sinopharm Group’s financial liquidity and debt levels to get an idea of whether the company can deal with cyclical downturns and maintain funds to accommodate strategic spending for future growth. Remember this is a very top-level look that focuses exclusively on financial health, so I recommend a deeper analysis into 1099 here.
View our latest analysis for Sinopharm Group
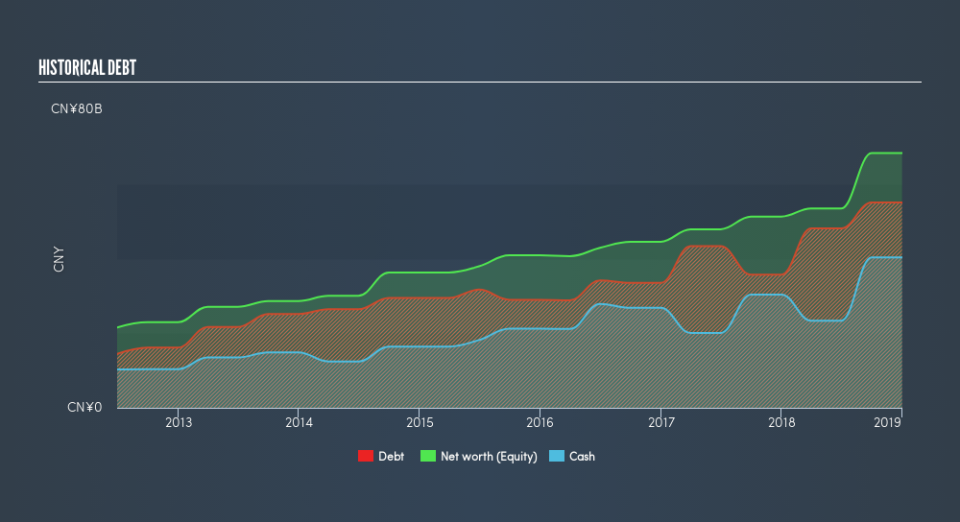
Does 1099 Produce Much Cash Relative To Its Debt?
1099 has built up its total debt levels in the last twelve months, from CN¥36b to CN¥55b , which accounts for long term debt. With this rise in debt, the current cash and short-term investment levels stands at CN¥40b , ready to be used for running the business. Moreover, 1099 has generated CN¥3.7b in operating cash flow over the same time period, resulting in an operating cash to total debt ratio of 6.6%, meaning that 1099’s current level of operating cash is not high enough to cover debt.
Can 1099 meet its short-term obligations with the cash in hand?
Looking at 1099’s CN¥160b in current liabilities, it appears that the company has been able to meet these commitments with a current assets level of CN¥205b, leading to a 1.28x current account ratio. The current ratio is the number you get when you divide current assets by current liabilities. Usually, for Healthcare companies, this is a suitable ratio since there is a bit of a cash buffer without leaving too much capital in a low-return environment.
Can 1099 service its debt comfortably?
With a debt-to-equity ratio of 81%, 1099 can be considered as an above-average leveraged company. This is not unusual for large-caps since debt tends to be less expensive than equity because interest payments are tax deductible. Consequently, larger-cap organisations tend to enjoy lower cost of capital as a result of easily attained financing, providing an advantage over smaller companies. We can check to see whether 1099 is able to meet its debt obligations by looking at the net interest coverage ratio. A company generating earnings before interest and tax (EBIT) at least three times its net interest payments is considered financially sound. In 1099's case, the ratio of 4.34x suggests that interest is well-covered. Large-cap investments like 1099 are often believed to be a safe investment due to their ability to pump out ample earnings multiple times its interest payments.
Next Steps:
1099’s debt and cash flow levels indicate room for improvement. Its cash flow coverage of less than a quarter of debt means that operating efficiency could be an issue. However, the company exhibits an ability to meet its near-term obligations, which isn't a big surprise for a large-cap. I admit this is a fairly basic analysis for 1099's financial health. Other important fundamentals need to be considered alongside. You should continue to research Sinopharm Group to get a more holistic view of the stock by looking at:
Future Outlook: What are well-informed industry analysts predicting for 1099’s future growth? Take a look at our free research report of analyst consensus for 1099’s outlook.
Valuation: What is 1099 worth today? Is the stock undervalued, even when its growth outlook is factored into its intrinsic value? The intrinsic value infographic in our free research report helps visualize whether 1099 is currently mispriced by the market.
Other High-Performing Stocks: Are there other stocks that provide better prospects with proven track records? Explore our free list of these great stocks here.
We aim to bring you long-term focused research analysis driven by fundamental data. Note that our analysis may not factor in the latest price-sensitive company announcements or qualitative material.
If you spot an error that warrants correction, please contact the editor at editorial-team@simplywallst.com. This article by Simply Wall St is general in nature. It does not constitute a recommendation to buy or sell any stock, and does not take account of your objectives, or your financial situation. Simply Wall St has no position in the stocks mentioned. Thank you for reading.

