What You Must Know About AT&T Inc’s (NYSE:T) Financial Strength

Investors seeking to preserve capital in a volatile environment might consider large-cap stocks such as AT&T Inc (NYSE:T) a safer option. One reason being its ‘too big to fail’ aura which gives it the appearance of a strong and stable investment. However, the key to their continued success lies in its financial health. Today we will look at AT&T’s financial liquidity and debt levels, which are strong indicators for whether the company can weather economic downturns or fund strategic acquisitions for future growth. Remember this is a very top-level look that focuses exclusively on financial health, so I recommend a deeper analysis into T here.
Check out our latest analysis for AT&T
Does T produce enough cash relative to debt?
Over the past year, T has ramped up its debt from US$165b to US$185b , which accounts for long term debt. With this rise in debt, T currently has US$8.7b remaining in cash and short-term investments , ready to deploy into the business. Additionally, T has generated cash from operations of US$42b during the same period of time, resulting in an operating cash to total debt ratio of 23%, meaning that T’s current level of operating cash is high enough to cover debt. This ratio can also be interpreted as a measure of efficiency as an alternative to return on assets. In T’s case, it is able to generate 0.23x cash from its debt capital.
Does T’s liquid assets cover its short-term commitments?
With current liabilities at US$65b, it appears that the company arguably has a rather low level of current assets relative its obligations, with the current ratio last standing at 0.81x.
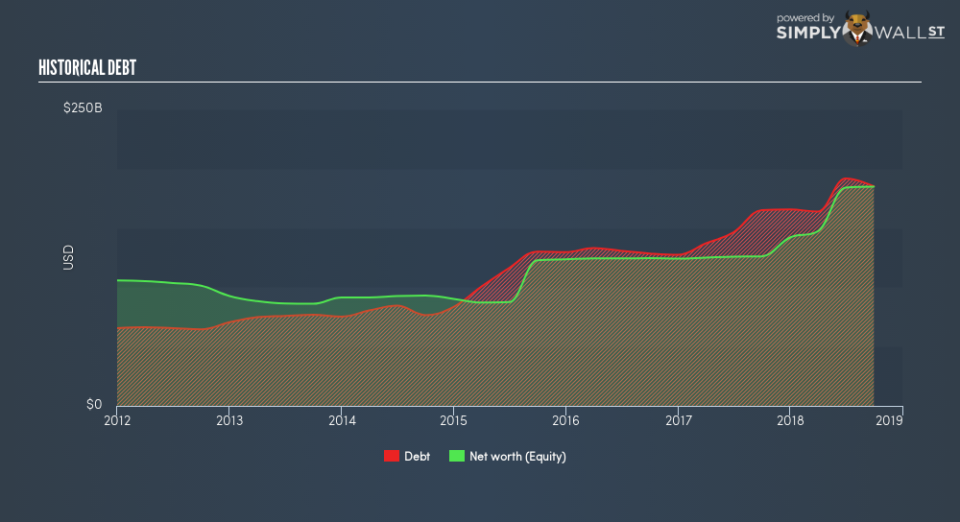
Can T service its debt comfortably?
Since equity is smaller than total debt levels, AT&T is considered to have high leverage. This isn’t uncommon for large companies because interest payments on debt are tax deductible, meaning debt can be a cheaper source of capital than equity. Since large-caps are seen as safer than their smaller constituents, they tend to enjoy lower cost of capital. We can check to see whether T is able to meet its debt obligations by looking at the net interest coverage ratio. A company generating earnings before interest and tax (EBIT) at least three times its net interest payments is considered financially sound. For T, the ratio of 3.55x suggests that interest is well-covered. It is considered a responsible and reassuring practice to maintain high interest coverage, which makes T and other large-cap investments thought to be safe.
Next Steps:
With a high level of debt on its balance sheet, T could still be in a financially strong position if its cash flow also stacked up. However, this isn’t the case, and there’s room for T to increase its operational efficiency. In addition to this, its lack of liquidity raises questions over current asset management practices for the large-cap. Keep in mind I haven’t considered other factors such as how T has been performing in the past. I recommend you continue to research AT&T to get a better picture of the stock by looking at:
Future Outlook: What are well-informed industry analysts predicting for T’s future growth? Take a look at our free research report of analyst consensus for T’s outlook.
Valuation: What is T worth today? Is the stock undervalued, even when its growth outlook is factored into its intrinsic value? The intrinsic value infographic in our free research report helps visualize whether T is currently mispriced by the market.
Other High-Performing Stocks: Are there other stocks that provide better prospects with proven track records? Explore our free list of these great stocks here.
To help readers see past the short term volatility of the financial market, we aim to bring you a long-term focused research analysis purely driven by fundamental data. Note that our analysis does not factor in the latest price-sensitive company announcements.
The author is an independent contributor and at the time of publication had no position in the stocks mentioned. For errors that warrant correction please contact the editor at editorial-team@simplywallst.com.
