Are Mycronic AB (publ)’s (STO:MYCR) High Returns Really That Great?

Today we'll evaluate Mycronic AB (publ) (STO:MYCR) to determine whether it could have potential as an investment idea. To be precise, we'll consider its Return On Capital Employed (ROCE), as that will inform our view of the quality of the business.
First, we'll go over how we calculate ROCE. Next, we'll compare it to others in its industry. And finally, we'll look at how its current liabilities are impacting its ROCE.
Understanding Return On Capital Employed (ROCE)
ROCE is a metric for evaluating how much pre-tax income (in percentage terms) a company earns on the capital invested in its business. In general, businesses with a higher ROCE are usually better quality. Ultimately, it is a useful but imperfect metric. Renowned investment researcher Michael Mauboussin has suggested that a high ROCE can indicate that 'one dollar invested in the company generates value of more than one dollar'.
How Do You Calculate Return On Capital Employed?
The formula for calculating the return on capital employed is:
Return on Capital Employed = Earnings Before Interest and Tax (EBIT) ÷ (Total Assets - Current Liabilities)
Or for Mycronic:
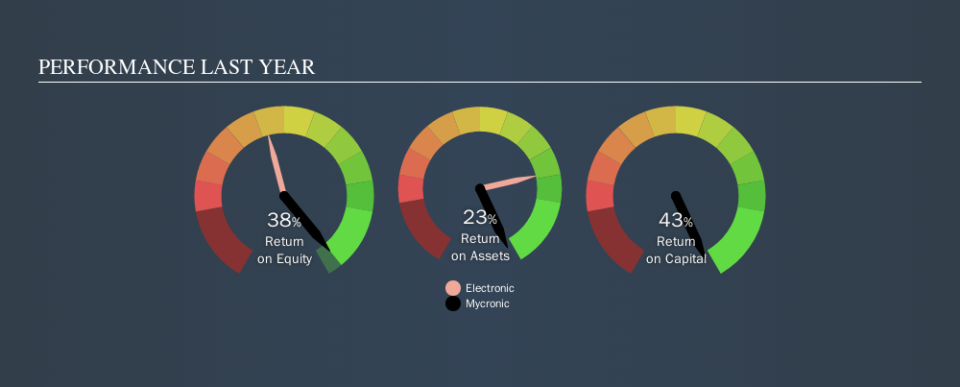
0.43 = kr1.3b ÷ (kr4.5b - kr1.5b) (Based on the trailing twelve months to June 2019.)
So, Mycronic has an ROCE of 43%.
Check out our latest analysis for Mycronic
Is Mycronic's ROCE Good?
When making comparisons between similar businesses, investors may find ROCE useful. Using our data, we find that Mycronic's ROCE is meaningfully better than the 13% average in the Electronic industry. We would consider this a positive, as it suggests it is using capital more effectively than other similar companies. Putting aside its position relative to its industry for now, in absolute terms, Mycronic's ROCE is currently very good.
Mycronic's current ROCE of 43% is lower than 3 years ago, when the company reported a 62% ROCE. So investors might consider if it has had issues recently. The image below shows how Mycronic's ROCE compares to its industry, and you can click it to see more detail on its past growth.
When considering this metric, keep in mind that it is backwards looking, and not necessarily predictive. Companies in cyclical industries can be difficult to understand using ROCE, as returns typically look high during boom times, and low during busts. This is because ROCE only looks at one year, instead of considering returns across a whole cycle. Since the future is so important for investors, you should check out our free report on analyst forecasts for Mycronic.
Do Mycronic's Current Liabilities Skew Its ROCE?
Current liabilities include invoices, such as supplier payments, short-term debt, or a tax bill, that need to be paid within 12 months. The ROCE equation subtracts current liabilities from capital employed, so a company with a lot of current liabilities appears to have less capital employed, and a higher ROCE than otherwise. To counter this, investors can check if a company has high current liabilities relative to total assets.
Mycronic has total assets of kr4.5b and current liabilities of kr1.5b. Therefore its current liabilities are equivalent to approximately 33% of its total assets. A medium level of current liabilities boosts Mycronic's ROCE somewhat.
Our Take On Mycronic's ROCE
Still, it has a high ROCE, and may be an interesting prospect for further research. Mycronic shapes up well under this analysis, but it is far from the only business delivering excellent numbers . You might also want to check this free collection of companies delivering excellent earnings growth.
For those who like to find winning investments this free list of growing companies with recent insider purchasing, could be just the ticket.
We aim to bring you long-term focused research analysis driven by fundamental data. Note that our analysis may not factor in the latest price-sensitive company announcements or qualitative material.
If you spot an error that warrants correction, please contact the editor at editorial-team@simplywallst.com. This article by Simply Wall St is general in nature. It does not constitute a recommendation to buy or sell any stock, and does not take account of your objectives, or your financial situation. Simply Wall St has no position in the stocks mentioned. Thank you for reading.
