Is N.V. Nederlandsche Apparatenfabriek Nedap's (AMS:NEDAP) High P/E Ratio A Problem For Investors?

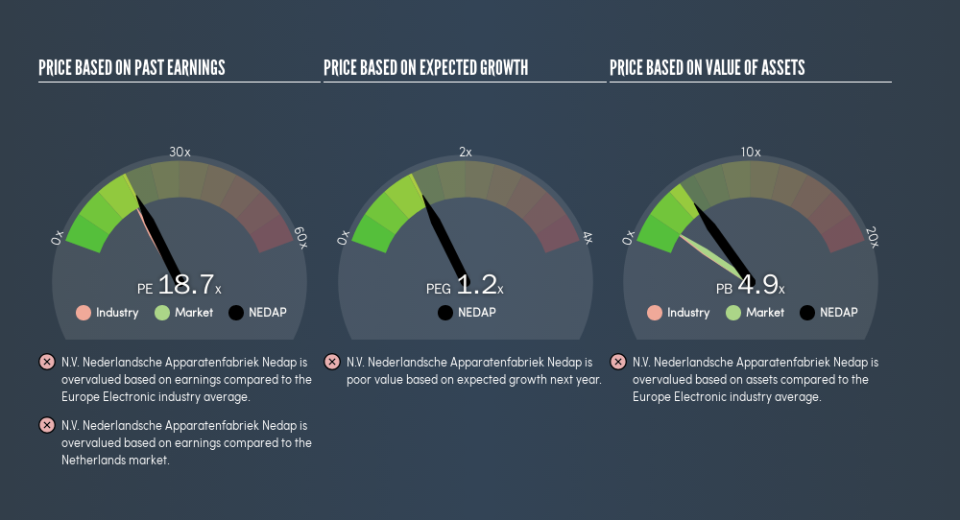
This article is written for those who want to get better at using price to earnings ratios (P/E ratios). To keep it practical, we'll show how N.V. Nederlandsche Apparatenfabriek Nedap's (AMS:NEDAP) P/E ratio could help you assess the value on offer. Looking at earnings over the last twelve months, N.V. Nederlandsche Apparatenfabriek Nedap has a P/E ratio of 18.65. That is equivalent to an earnings yield of about 5.4%.
Check out our latest analysis for N.V. Nederlandsche Apparatenfabriek Nedap
How Do You Calculate A P/E Ratio?
The formula for P/E is:
Price to Earnings Ratio = Share Price ÷ Earnings per Share (EPS)
Or for N.V. Nederlandsche Apparatenfabriek Nedap:
P/E of 18.65 = €49.7 ÷ €2.66 (Based on the year to December 2018.)
Is A High Price-to-Earnings Ratio Good?
A higher P/E ratio implies that investors pay a higher price for the earning power of the business. That isn't a good or a bad thing on its own, but a high P/E means that buyers have a higher opinion of the business's prospects, relative to stocks with a lower P/E.
How Growth Rates Impact P/E Ratios
Probably the most important factor in determining what P/E a company trades on is the earnings growth. That's because companies that grow earnings per share quickly will rapidly increase the 'E' in the equation. That means unless the share price increases, the P/E will reduce in a few years. A lower P/E should indicate the stock is cheap relative to others -- and that may attract buyers.
In the last year, N.V. Nederlandsche Apparatenfabriek Nedap grew EPS like Taylor Swift grew her fan base back in 2010; the 99% gain was both fast and well deserved. And earnings per share have improved by 56% annually, over the last three years. So we'd absolutely expect it to have a relatively high P/E ratio.
Does N.V. Nederlandsche Apparatenfabriek Nedap Have A Relatively High Or Low P/E For Its Industry?
We can get an indication of market expectations by looking at the P/E ratio. You can see in the image below that the average P/E (17.3) for companies in the electronic industry is lower than N.V. Nederlandsche Apparatenfabriek Nedap's P/E.
That means that the market expects N.V. Nederlandsche Apparatenfabriek Nedap will outperform other companies in its industry. Clearly the market expects growth, but it isn't guaranteed. So further research is always essential. I often monitor director buying and selling.
Remember: P/E Ratios Don't Consider The Balance Sheet
The 'Price' in P/E reflects the market capitalization of the company. So it won't reflect the advantage of cash, or disadvantage of debt. In theory, a company can lower its future P/E ratio by using cash or debt to invest in growth.
While growth expenditure doesn't always pay off, the point is that it is a good option to have; but one that the P/E ratio ignores.
Is Debt Impacting N.V. Nederlandsche Apparatenfabriek Nedap's P/E?
N.V. Nederlandsche Apparatenfabriek Nedap has net debt worth just 5.2% of its market capitalization. The market might award it a higher P/E ratio if it had net cash, but its unlikely this low level of net borrowing is having a big impact on the P/E multiple.
The Bottom Line On N.V. Nederlandsche Apparatenfabriek Nedap's P/E Ratio
N.V. Nederlandsche Apparatenfabriek Nedap trades on a P/E ratio of 18.7, which is fairly close to the NL market average of 18. With only modest debt levels, and strong earnings growth, the market seems to doubt that the growth can be maintained.
Investors should be looking to buy stocks that the market is wrong about. People often underestimate remarkable growth -- so investors can make money when fast growth is not fully appreciated. So this free report on the analyst consensus forecasts could help you make a master move on this stock.
But note: N.V. Nederlandsche Apparatenfabriek Nedap may not be the best stock to buy. So take a peek at this free list of interesting companies with strong recent earnings growth (and a P/E ratio below 20).
We aim to bring you long-term focused research analysis driven by fundamental data. Note that our analysis may not factor in the latest price-sensitive company announcements or qualitative material.
If you spot an error that warrants correction, please contact the editor at editorial-team@simplywallst.com. This article by Simply Wall St is general in nature. It does not constitute a recommendation to buy or sell any stock, and does not take account of your objectives, or your financial situation. Simply Wall St has no position in the stocks mentioned. Thank you for reading.
