National Grid plc (LON:NG.): Time For A Financial Health Check

Want to participate in a short research study? Help shape the future of investing tools and receive a $20 prize!
Investors seeking to preserve capital in a volatile environment might consider large-cap stocks such as National Grid plc (LON:NG.) a safer option. Risk-averse investors who are attracted to diversified streams of revenue and strong capital returns tend to seek out these large companies. But, the key to their continued success lies in its financial health. This article will examine National Grid’s financial liquidity and debt levels to get an idea of whether the company can deal with cyclical downturns and maintain funds to accommodate strategic spending for future growth. Note that this information is centred entirely on financial health and is a high-level overview, so I encourage you to look further into NG. here.
Check out our latest analysis for National Grid
How does NG.’s operating cash flow stack up against its debt?
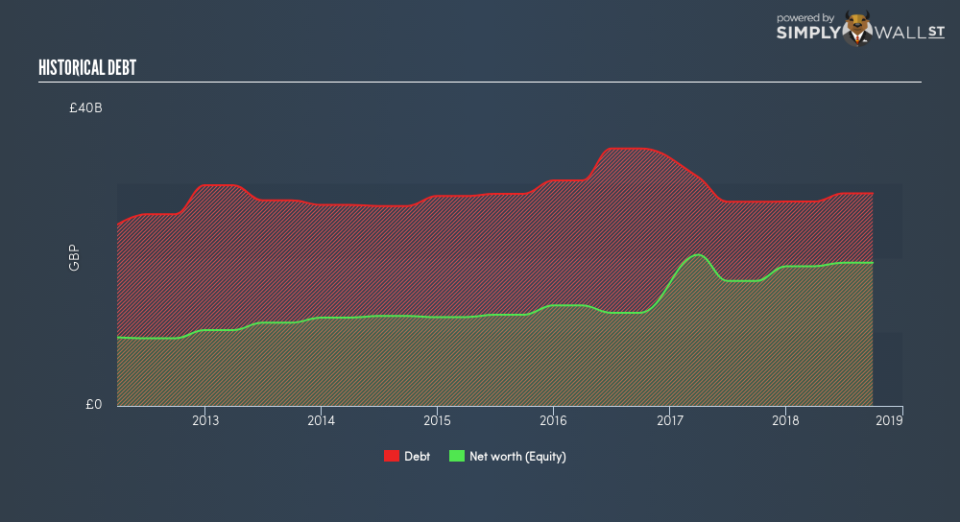
Over the past year, NG. has maintained its debt levels at around UK£29b – this includes long-term debt. At this constant level of debt, NG.’s cash and short-term investments stands at UK£1.8b , ready to deploy into the business. On top of this, NG. has generated UK£4.4b in operating cash flow over the same time period, leading to an operating cash to total debt ratio of 16%, indicating that NG.’s debt is not appropriately covered by operating cash. This ratio can also be interpreted as a measure of efficiency as an alternative to return on assets. In NG.’s case, it is able to generate 0.16x cash from its debt capital.
Can NG. meet its short-term obligations with the cash in hand?
Looking at NG.’s UK£8.2b in current liabilities, it seems that the business arguably has a rather low level of current assets relative its obligations, with the current ratio last standing at 0.85x.
Is NG.’s debt level acceptable?
National Grid is a highly levered company given that total debt exceeds equity. This is common amongst large-cap companies because debt can often be a less expensive alternative to equity due to tax deductibility of interest payments. Consequently, larger-cap organisations tend to enjoy lower cost of capital as a result of easily attained financing, providing an advantage over smaller companies. By measuring how many times NG.’s earnings can cover interest payments, we can evaluate whether its level of debt is sustainable or not. Ideally, earnings before interest and tax (EBIT) should cover net interest by at least three times. In NG.’s case, the ratio of 3.77x suggests that interest is well-covered. Large-cap investments like NG. are often believed to be a safe investment due to their ability to pump out ample earnings multiple times its interest payments.
Next Steps:
NG.’s high debt levels is not met with high cash flow coverage. This leaves room for improvement in terms of debt management and operational efficiency. In addition to this, its lack of liquidity raises questions over current asset management practices for the large-cap. This is only a rough assessment of financial health, and I’m sure NG. has company-specific issues impacting its capital structure decisions. I suggest you continue to research National Grid to get a better picture of the stock by looking at:
Future Outlook: What are well-informed industry analysts predicting for NG.’s future growth? Take a look at our free research report of analyst consensus for NG.’s outlook.
Historical Performance: What has NG.’s returns been like over the past? Go into more detail in the past track record analysis and take a look at the free visual representations of our analysis for more clarity.
Other High-Performing Stocks: Are there other stocks that provide better prospects with proven track records? Explore our free list of these great stocks here.
We aim to bring you long-term focused research analysis driven by fundamental data. Note that our analysis may not factor in the latest price-sensitive company announcements or qualitative material.
If you spot an error that warrants correction, please contact the editor at editorial-team@simplywallst.com. This article by Simply Wall St is general in nature. It does not constitute a recommendation to buy or sell any stock, and does not take account of your objectives, or your financial situation. Simply Wall St has no position in the stocks mentioned. Thank you for reading.

