Natural Gas Price Futures (NG) Technical Analysis – Strengthens Over $8.085, Weakens Under $7.786
U.S. natural gas futures closed lower on Friday on weather forecasts calling for milder temperatures and lower demand over the next two weeks.
A 3% decline in European gas futures also weighed on prices. The weakness in Europe was a surprise since exports from Russia were down due to sanctions and the shutdown of a pipeline in Ukraine.
On Friday, July natural gas futures settled at $7.765, down $0.070 or -0.89%. The United States Natural Gas Fund ETF (UNG) finished at $26.27, down $0.21 or -0.79%.
In another surprise, U.S. price decreased even as Texas prepares for a heatwave early next week that will boost power demand for air conditioning.
Daily Swing Chart Technical Analysis
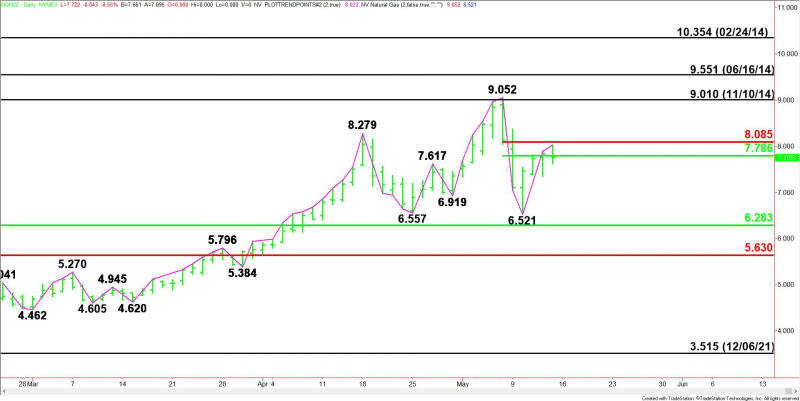
The main trend is down according to the daily swing chart. The trend turned down last week when sellers took out a pair of main bottoms at $6.919 and $6.557.
A trade through $6.521 will signal a resumption of the downtrend. A move through $9.052 will change the main trend to up.
The short-term range is $9.052 to $6.521. Its retracement zone at $7.786 to $8.085 stopped the rally on Friday at $8.022.
The main range is $3.515 to $9.052. Its retracement zone at $6.283 to $5.630 is the key support zone.
Daily Swing Chart Technical Forecast
The direction of the July natural gas futures market early Monday will be determined by trader reaction to $7.786.
Bullish Scenario
A sustained move over $7.786 will indicate the presence of buyers. The first upside target is a short-term Fibonacci level at $8.085. This is a potential trigger point for an acceleration to the upside with $9.052 the next likely upside target.
Bearish Scenario
A sustained move under $7.786 will signal the presence of sellers. If this move generates enough downside momentum then look for the selling to possibly extend into a minor pivot at $7.272.
Watch for a technical bounce on the first test of $7.272 as counter-trend buyers try to form a potentially bullish secondary higher bottom. If this level fails as support, the selling could possibly extend into the main bottom at $6.521, followed by the retracement zone target at $6.283 to $5.630.
For a look at all of today’s economic events, check out our economic calendar.
This article was originally posted on FX Empire
