NetApp (NTAP) Just Overtook the 20-Day Moving Average
From a technical perspective, NetApp (NTAP) is looking like an interesting pick, as it just reached a key level of support. NTAP recently overtook the 20-day moving average, and this suggests a short-term bullish trend.
The 20-day simple moving average is a well-liked trading tool because it provides a look back at a stock's price over a 20-day period. Additionally, short-term traders find this SMA very beneficial, as it smooths out short-term price trends and shows more trend reversal signals than longer-term moving averages.
The 20-day moving average can show signals that are similar to other SMAs as well. If a stock's price is moving above the 20-day, the trend is considered positive. When the price falls below the moving average, it can signal a downward trend.
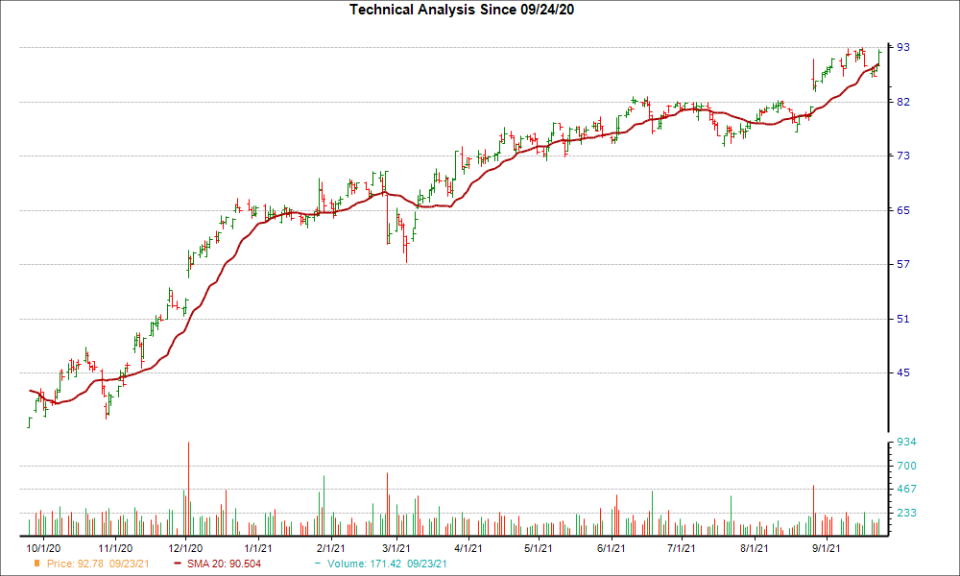
Shares of NTAP have been moving higher over the past four weeks, up 7.7%. Plus, the company is currently a Zacks Rank #3 (Hold) stock, suggesting that NTAP could be poised for a continued surge.
The bullish case only gets stronger once investors take into account NTAP's positive earnings estimate revisions. There have been 9 revisions higher for the current fiscal year compared to none lower, and the consensus estimate has moved up as well.
With a winning combination of earnings estimate revisions and hitting a key technical level, investors should keep their eye on NTAP for more gains in the near future.
Want the latest recommendations from Zacks Investment Research? Today, you can download 7 Best Stocks for the Next 30 Days. Click to get this free report
NetApp, Inc. (NTAP) : Free Stock Analysis Report
To read this article on Zacks.com click here.
