The Chart That Proved Poker Is a Game of Skill
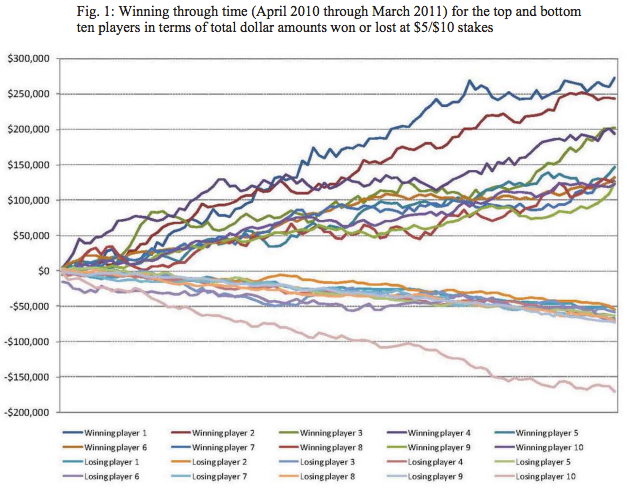
When New York federal judge Jack Weinstein ruled last week that poker is indeed a game of skill, he based the decision off defendant Lawrence DiCristina's 120-page report that included this striking chart showing the difference in earnings between the ten best and worst poker players in a study.
RELATED: After New FBI Crackdown on Internet Gambling, Poker Players Mourn
RELATED: There Will Be a Lot Less Poker on TV
DiCristina took the chart from economist Randal Heeb, who studied 415 million hands of No Limit Texas Hold’em on website PokerStars in the course of a year. The y-axis represents cumulative earnings and the x-axis is time.
RELATED: The Sorry History of Celebrities at the World Series of Poker
As you can see, top winners keep winning, and top losers keep losing. Heeb concluded that though luck played a role, “[t]he fact that the winning players tend to win consistently and the losing players tend to lose consistently demonstrates that there is a skill differential between these groups.”
RELATED: Feds Accuse Full Tilt Poker of Being a 'Global Ponzi Scheme'
This and other charts convinced Judge Weinstein to rule that an electronics dealer was not violating a gambling law on the premise that poker is, in fact, more about skill.
Chart from jurist.org (pdf) via flowingdata
