Here’s What NextEra Energy, Inc.’s (NYSE:NEE) P/E Ratio Is Telling Us

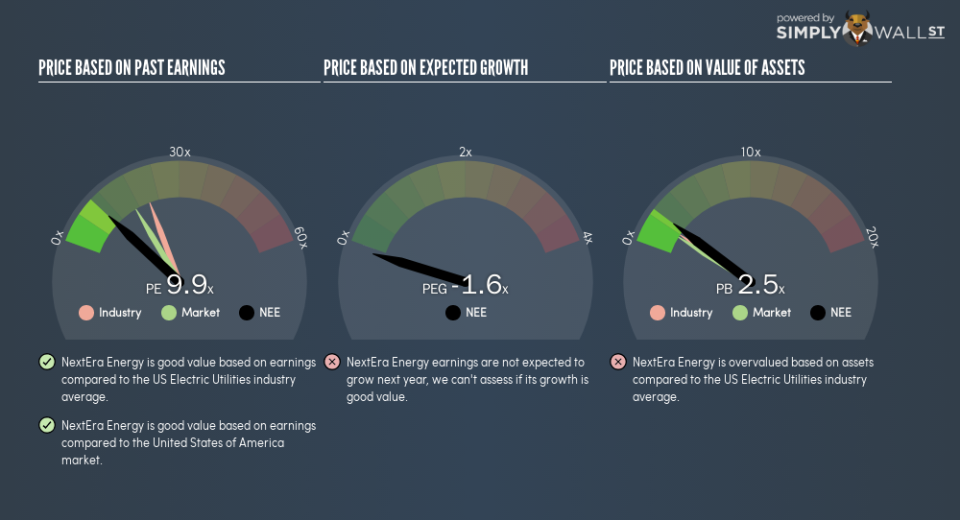
This article is written for those who want to get better at using price to earnings ratios (P/E ratios). We’ll look at NextEra Energy, Inc.’s (NYSE:NEE) P/E ratio and reflect on what it tells us about the company’s share price. NextEra Energy has a price to earnings ratio of 9.88, based on the last twelve months. That corresponds to an earnings yield of approximately 10%.
See our latest analysis for NextEra Energy
How Do I Calculate NextEra Energy’s Price To Earnings Ratio?
The formula for price to earnings is:
Price to Earnings Ratio = Share Price ÷ Earnings per Share (EPS)
Or for NextEra Energy:
P/E of 9.88 = $175.65 ÷ $17.79 (Based on the year to September 2018.)
Is A High P/E Ratio Good?
A higher P/E ratio implies that investors pay a higher price for the earning power of the business. All else being equal, it’s better to pay a low price — but as Warren Buffett said, ‘It’s far better to buy a wonderful company at a fair price than a fair company at a wonderful price.’
How Growth Rates Impact P/E Ratios
Probably the most important factor in determining what P/E a company trades on is the earnings growth. That’s because companies that grow earnings per share quickly will rapidly increase the ‘E’ in the equation. That means even if the current P/E is high, it will reduce over time if the share price stays flat. Then, a lower P/E should attract more buyers, pushing the share price up.
NextEra Energy increased earnings per share by a whopping 99% last year. And earnings per share have improved by 30% annually, over the last five years. With that performance, I would expect it to have an above average P/E ratio.
How Does NextEra Energy’s P/E Ratio Compare To Its Peers?
The P/E ratio essentially measures market expectations of a company. The image below shows that NextEra Energy has a lower P/E than the average (20.6) P/E for companies in the electric utilities industry.
This suggests that market participants think NextEra Energy will underperform other companies in its industry. Since the market seems unimpressed with NextEra Energy, it’s quite possible it could surprise on the upside. You should delve deeper. I like to check if company insiders have been buying or selling.
Remember: P/E Ratios Don’t Consider The Balance Sheet
Don’t forget that the P/E ratio considers market capitalization. That means it doesn’t take debt or cash into account. Hypothetically, a company could reduce its future P/E ratio by spending its cash (or taking on debt) to achieve higher earnings.
Such spending might be good or bad, overall, but the key point here is that you need to look at debt to understand the P/E ratio in context.
NextEra Energy’s Balance Sheet
NextEra Energy’s net debt is 37% of its market cap. This is enough debt that you’d have to make some adjustments before using the P/E ratio to compare it to a company with net cash.
The Bottom Line On NextEra Energy’s P/E Ratio
NextEra Energy has a P/E of 9.9. That’s below the average in the US market, which is 16.5. The company does have a little debt, and EPS growth was good last year. The low P/E ratio suggests current market expectations are muted, implying these levels of growth will not continue.
When the market is wrong about a stock, it gives savvy investors an opportunity. If it is underestimating a company, investors can make money by buying and holding the shares until the market corrects itself. So this free visualization of the analyst consensus on future earnings could help you make the right decision about whether to buy, sell, or hold.
Of course, you might find a fantastic investment by looking at a few good candidates. So take a peek at this free list of companies with modest (or no) debt, trading on a P/E below 20.
To help readers see past the short term volatility of the financial market, we aim to bring you a long-term focused research analysis purely driven by fundamental data. Note that our analysis does not factor in the latest price-sensitive company announcements.
The author is an independent contributor and at the time of publication had no position in the stocks mentioned. For errors that warrant correction please contact the editor at editorial-team@simplywallst.com.

