Here’s What Niraku GC Holdings, Inc.’s (HKG:1245) Return On Capital Can Tell Us

Today we’ll look at Niraku GC Holdings, Inc. (HKG:1245) and reflect on its potential as an investment. Specifically, we’re going to calculate its Return On Capital Employed (ROCE), in the hopes of getting some insight into the business.
Firstly, we’ll go over how we calculate ROCE. Second, we’ll look at its ROCE compared to similar companies. And finally, we’ll look at how its current liabilities are impacting its ROCE.
What is Return On Capital Employed (ROCE)?
ROCE measures the amount of pre-tax profits a company can generate from the capital employed in its business. All else being equal, a better business will have a higher ROCE. Overall, it is a valuable metric that has its flaws. Renowned investment researcher Michael Mauboussin has suggested that a high ROCE can indicate that ‘one dollar invested in the company generates value of more than one dollar’.
So, How Do We Calculate ROCE?
Analysts use this formula to calculate return on capital employed:
Return on Capital Employed = Earnings Before Interest and Tax (EBIT) ÷ (Total Assets – Current Liabilities)
Or for Niraku GC Holdings:
0.046 = JP¥2.0b ÷ (JP¥53b – JP¥9.9b) (Based on the trailing twelve months to September 2018.)
So, Niraku GC Holdings has an ROCE of 4.6%.
View our latest analysis for Niraku GC Holdings
Does Niraku GC Holdings Have A Good ROCE?
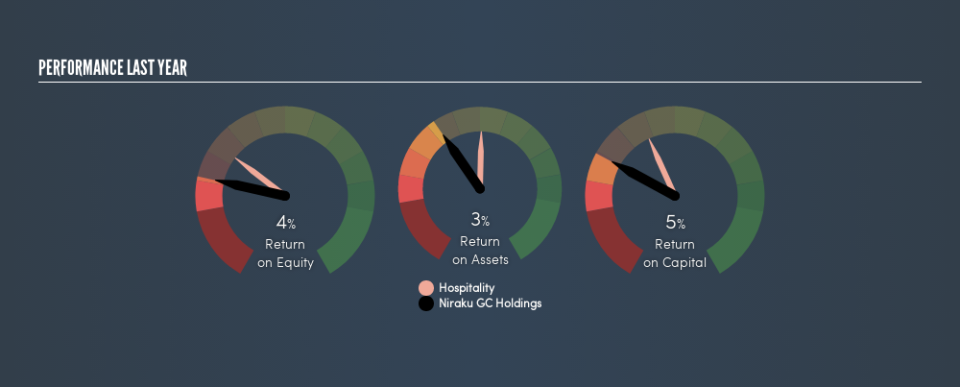
When making comparisons between similar businesses, investors may find ROCE useful. Using our data, Niraku GC Holdings’s ROCE appears to be around the 5.7% average of the Hospitality industry. Regardless of how Niraku GC Holdings stacks up against its industry, its ROCE in absolute terms is quite low (especially compared to a bank account). Readers may wish to look for more rewarding investments.
Niraku GC Holdings’s current ROCE of 4.6% is lower than its ROCE in the past, which was 9.1%, 3 years ago. So investors might consider if it has had issues recently.
It is important to remember that ROCE shows past performance, and is not necessarily predictive. Companies in cyclical industries can be difficult to understand using ROCE, as returns typically look high during boom times, and low during busts. This is because ROCE only looks at one year, instead of considering returns across a whole cycle. If Niraku GC Holdings is cyclical, it could make sense to check out this free graph of past earnings, revenue and cash flow.
Niraku GC Holdings’s Current Liabilities And Their Impact On Its ROCE
Current liabilities are short term bills and invoices that need to be paid in 12 months or less. Due to the way the ROCE equation works, having large bills due in the near term can make it look as though a company has less capital employed, and thus a higher ROCE than usual. To counter this, investors can check if a company has high current liabilities relative to total assets.
Niraku GC Holdings has total liabilities of JP¥9.9b and total assets of JP¥53b. Therefore its current liabilities are equivalent to approximately 19% of its total assets. With a very reasonable level of current liabilities, so the impact on ROCE is fairly minimal.
Our Take On Niraku GC Holdings’s ROCE
Niraku GC Holdings has a poor ROCE, and there may be better investment prospects out there. You might be able to find a better buy than Niraku GC Holdings. If you want a selection of possible winners, check out this free list of interesting companies that trade on a P/E below 20 (but have proven they can grow earnings).
For those who like to find winning investments this free list of growing companies with recent insider purchasing, could be just the ticket.
We aim to bring you long-term focused research analysis driven by fundamental data. Note that our analysis may not factor in the latest price-sensitive company announcements or qualitative material.
If you spot an error that warrants correction, please contact the editor at editorial-team@simplywallst.com. This article by Simply Wall St is general in nature. It does not constitute a recommendation to buy or sell any stock, and does not take account of your objectives, or your financial situation. Simply Wall St has no position in the stocks mentioned. Thank you for reading.
