What is ‘normal’ earthquake activity in Yellowstone National Park?
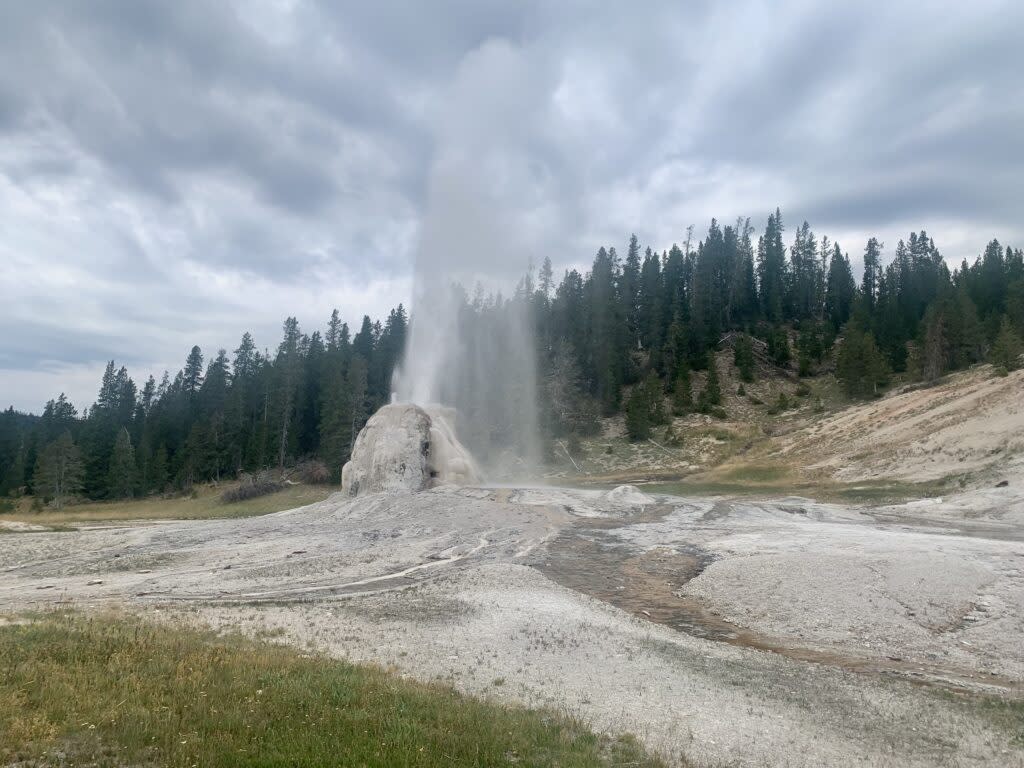
Eruptions from the Lone Star Geyser send steaming hot water 45 feet into the air in Yellowstone National Park. (Clark Corbin/Idaho Capital Sun)
In the monthly seismicity reports for Yellowstone, it is common to read the statement, “earthquake activity in Yellowstone remains at background levels.”
In fact, in the United States Geological Survey monthly activity reports, there is an alert level assigned to each volcano, Yellowstone included. The “normal” alert level is associated with a “non-erupting volcano that is exhibiting typical background activity.” The “advisory” alert level is associated with a “volcano that is exhibiting signs of elevated unrest above known background activity.”
So, the question is, how do we know what is normal versus something that may be associated with a possible eruption?

This is a map of Yellowstone National Park and the earthquakes that were located there from 1973-2023. Red circles are earthquakes located in the Yellowstone region, and blue circles indicate swarm seismicity. The size of the circle scales with the magnitude of the earthquake. (Courtesy of the Yellowstone Caldera Chronicles)
In terms of earthquake activity in the Yellowstone region, it is typical for Yellowstone Volcano Observatory to state that the Yellowstone region experiences 1,500–2,500 earthquakes per year.
These numbers are based on seismicity over the last 30 years, from 1995 to present. During that time period, the year with the most earthquakes was 2017, with 3,427 events, and the year with the least number of earthquakes was 2011, with 708 events.
As with most natural systems, Yellowstone doesn’t behave in a linear or predictable fashion, so simply taking the average number of annual earthquakes wouldn’t represent the range that is characteristic of such a dynamic system.
One of the reasons why the annual number of earthquakes has such a large range is because roughly half of Yellowstone earthquakes occur as part of earthquake swarms — groupings of seismic events that are clustered in both time and space. Individual swarms can have as little as 10 events and last for less than an hour or up to thousands of events and last for many months (the 2017 Maple Creek swarm is an example). Typically, years with high numbers of earthquakes, like 2017, have been characterized by large swarms.
Another thing you may be wondering: Yellowstone has been seismically monitored since the early 1970s, so why is the range of “normal” seismic activity based on 1995 to present?
This is because the seismic network has grown and improved over the years. If you look at a plot of earthquakes over time, you can see an apparent increase in seismicity around the year 1995. Prior to 1995, the Yellowstone Seismic Network had fewer stations. Around 1995, the network was upgraded substantially with not only additional stations, but also stations with newer technology (including data transmission) that allowed for the identification and location of more earthquakes (typically smaller magnitude events). Those earthquakes were always happening, but prior to this upgrade in the network we were unable to locate them.
So, the apparent increase in seismicity rate around 1995 is not real; it is simply because the better network allowed us to identify and locate more of the seismicity that was occurring.

This is a histogram, or a visual representation of the distribution of numeric data, showing the number of earthquakes per three-month period in the Yellowstone National Park region from 1973–2023. Red bars represent all earthquakes located in the Yellowstone region, and blue bars indicate swarm seismicity. (Courtesy of the Yellowstone Caldera Chronicles)
Even though we’ve continued to improve the Yellowstone Seismic Network to the present day (including a new station installed just last summer!), the network since 1995 has had the coverage needed to detect most earthquakes occurring in the region. Seismicity rate changes since 1995 are therefore most-likely representative of real variation in the system.
Volcanic systems like Yellowstone are naturally dynamic; however, there are patterns over time that can be determined by careful monitoring and study. The longer we have monitoring equipment that records earthquake activity (and other tectonic, hydrothermal, and volcanic signals), the more likely that we will be able to identify periods of “unusual” behavior. But, just because there is elevated seismicity (above the average), doesn’t mean that an eruption is imminent, regardless of what you may see online.
Yellowstone Caldera Chronicles is a weekly column written by scientists and collaborators of the Yellowstone Volcano Observatory.
GET THE MORNING HEADLINES DELIVERED TO YOUR INBOX
The post What is ‘normal’ earthquake activity in Yellowstone National Park? appeared first on Idaho Capital Sun.

