Is NorthWestern Corporation's (NYSE:NWE) Capital Allocation Ability Worth Your Time?

Want to participate in a short research study? Help shape the future of investing tools and you could win a $250 gift card!
Today we'll look at NorthWestern Corporation (NYSE:NWE) and reflect on its potential as an investment. Specifically, we'll consider its Return On Capital Employed (ROCE), since that will give us an insight into how efficiently the business can generate profits from the capital it requires.
First up, we'll look at what ROCE is and how we calculate it. Next, we'll compare it to others in its industry. Then we'll determine how its current liabilities are affecting its ROCE.
Understanding Return On Capital Employed (ROCE)
ROCE measures the 'return' (pre-tax profit) a company generates from capital employed in its business. In general, businesses with a higher ROCE are usually better quality. Overall, it is a valuable metric that has its flaws. Renowned investment researcher Michael Mauboussin has suggested that a high ROCE can indicate that 'one dollar invested in the company generates value of more than one dollar'.
How Do You Calculate Return On Capital Employed?
Analysts use this formula to calculate return on capital employed:
Return on Capital Employed = Earnings Before Interest and Tax (EBIT) ÷ (Total Assets - Current Liabilities)
Or for NorthWestern:
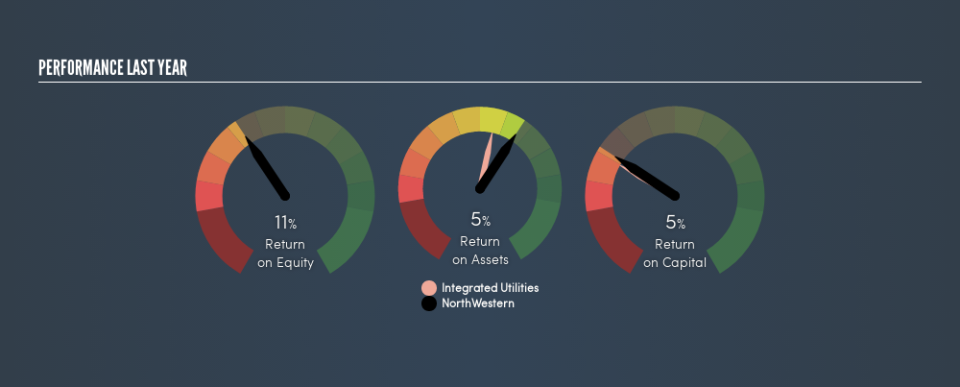
0.052 = US$279m ÷ (US$5.7b - US$347m) (Based on the trailing twelve months to March 2019.)
Therefore, NorthWestern has an ROCE of 5.2%.
See our latest analysis for NorthWestern
Is NorthWestern's ROCE Good?
ROCE can be useful when making comparisons, such as between similar companies. Using our data, NorthWestern's ROCE appears to be around the 5.2% average of the Integrated Utilities industry. Independently of how NorthWestern compares to its industry, its ROCE in absolute terms is low; especially compared to the ~2.7% available in government bonds. It is likely that there are more attractive prospects out there.
When considering this metric, keep in mind that it is backwards looking, and not necessarily predictive. ROCE can be deceptive for cyclical businesses, as returns can look incredible in boom times, and terribly low in downturns. ROCE is, after all, simply a snap shot of a single year. Future performance is what matters, and you can see analyst predictions in our free report on analyst forecasts for the company.
What Are Current Liabilities, And How Do They Affect NorthWestern's ROCE?
Liabilities, such as supplier bills and bank overdrafts, are referred to as current liabilities if they need to be paid within 12 months. Due to the way the ROCE equation works, having large bills due in the near term can make it look as though a company has less capital employed, and thus a higher ROCE than usual. To counter this, investors can check if a company has high current liabilities relative to total assets.
NorthWestern has total liabilities of US$347m and total assets of US$5.7b. As a result, its current liabilities are equal to approximately 6.1% of its total assets. With barely any current liabilities, there is minimal impact on NorthWestern's admittedly low ROCE.
What We Can Learn From NorthWestern's ROCE
Still, investors could probably find more attractive prospects with better performance out there. But note: make sure you look for a great company, not just the first idea you come across. So take a peek at this free list of interesting companies with strong recent earnings growth (and a P/E ratio below 20).
For those who like to find winning investments this free list of growing companies with recent insider purchasing, could be just the ticket.
We aim to bring you long-term focused research analysis driven by fundamental data. Note that our analysis may not factor in the latest price-sensitive company announcements or qualitative material.
If you spot an error that warrants correction, please contact the editor at editorial-team@simplywallst.com. This article by Simply Wall St is general in nature. It does not constitute a recommendation to buy or sell any stock, and does not take account of your objectives, or your financial situation. Simply Wall St has no position in the stocks mentioned. Thank you for reading.

