November 2021 Housing Statistics
What is the current state of the real estate market? See below for the Greater Lansing Association of REALTORS® analysis of latest local statistics.
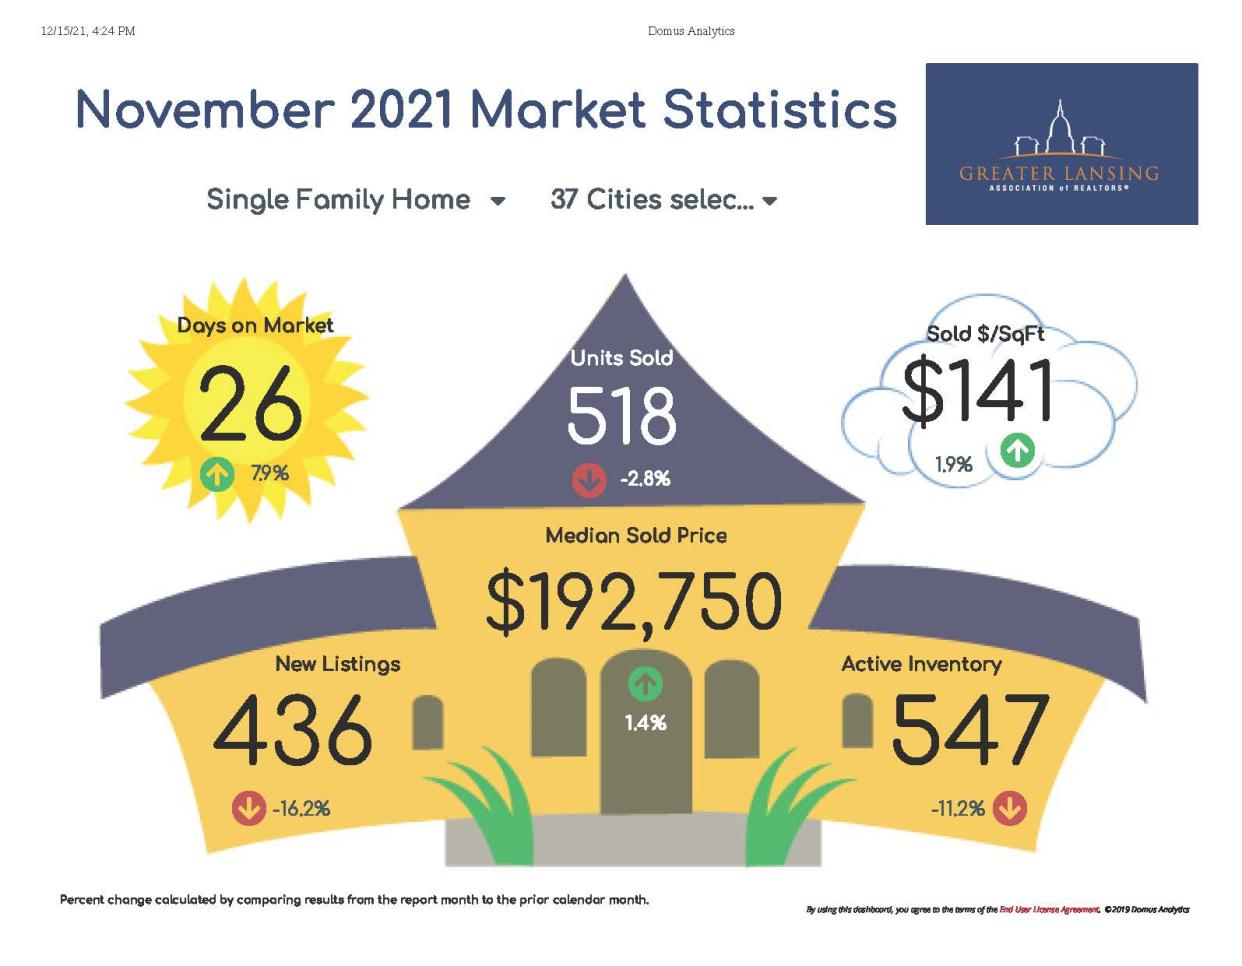
Median Sold Price
The median sold price slightly increased from $189,950 in October to $192,750 this November. This is nearly seven percent higher than the same time in 2020 which had a median sold price of $180,253.
Along with the median sold price, the average price per square foot also increased. The average price per square foot is now $141, just under two percent higher than October’s average price per square foot of $138. This is 10.5 percent more than the same time in November 2020 when it was $127.
The municipality in the local area with the highest median sold price this past month is DeWitt with $353,500. The next highest municipality is Dansville at $350,000.
Units Sold
A total of 518 units were sold in November. This is lower than October 2021 by 15 units, almost three percent.
This is more than an eight percent decrease from November 2020 which had 567 units sold.
The local municipality with the most units sold in the Mid-Michigan area is Lansing. It leads the way by far with 205 units sold. The next highest selling municipality is East Lansing with 36 units sold.
New Listings
There was a 16 percent drop in new listings from October to November. November had a total number of 436 new listings compared to 520 in October. However, this is a small increase from November 2020 which saw 423 new listings.
Active Inventory
Inventory is down eleven percent from last month. November had an active inventory of 547 units compared to October which had 616 active units.
If you have been thinking about selling your house, it may be a great time to do so as it continues to be a seller’s market. The average of the percentage of ask received by sellers is more than 100 percent.
Days on Market
The amount of days a unit spends on the market has increased by a few days since last month. On average, homes in November were on the market for an average of 26 days compared to 24 days in October. Last November a house was on the market for an average of 30 days.
Remember, real estate is all about location, location, location, so statistics will vary based on area. Statistics in the infographic provided are based on averages for all municipalities in the mid-Michigan region and do not identify a specific location except when noted. All statistics mentioned refer to single family housing.
Are you interested in buying or selling your home? Contact a local real estate professional to help navigate through these market conditions. Visit www.lansing-realestate.com for a list of local REALTORS®, lenders, inspectors, and more.
This article originally appeared on Lansing State Journal: November 2021 Housing Statistics

