Is Nu Skin Enterprises, Inc.'s (NYSE:NUS) Balance Sheet Strong Enough To Weather A Storm?

Want to participate in a short research study? Help shape the future of investing tools and you could win a $250 gift card!
Investors are always looking for growth in small-cap stocks like Nu Skin Enterprises, Inc. (NYSE:NUS), with a market cap of US$2.8b. However, an important fact which most ignore is: how financially healthy is the business? Evaluating financial health as part of your investment thesis is crucial, as mismanagement of capital can lead to bankruptcies, which occur at a higher rate for small-caps. Let's work through some financial health checks you may wish to consider if you're interested in this stock. Nevertheless, these checks don't give you a full picture, so I’d encourage you to dig deeper yourself into NUS here.
Does NUS Produce Much Cash Relative To Its Debt?
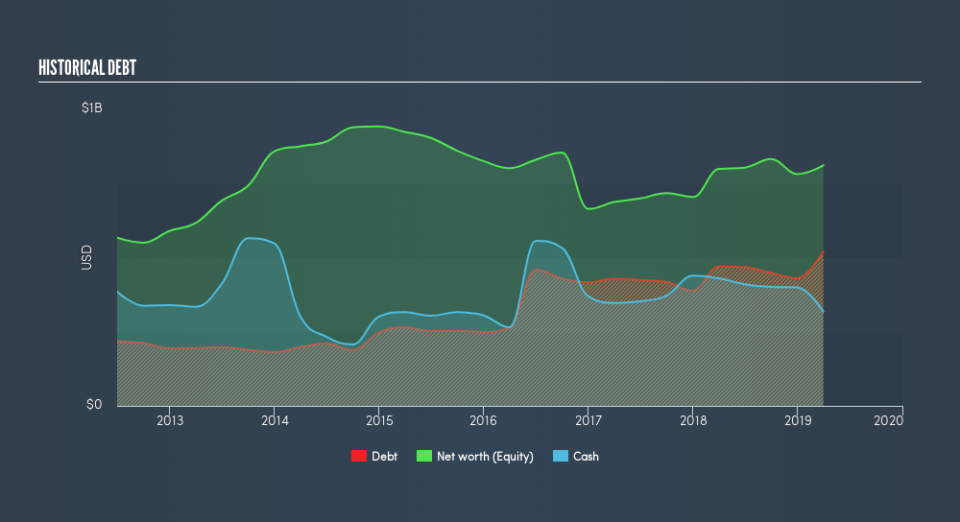
NUS's debt levels surged from US$470m to US$521m over the last 12 months – this includes long-term debt. With this growth in debt, the current cash and short-term investment levels stands at US$318m to keep the business going. Moreover, NUS has generated cash from operations of US$196m during the same period of time, resulting in an operating cash to total debt ratio of 38%, signalling that NUS’s operating cash is sufficient to cover its debt.
Does NUS’s liquid assets cover its short-term commitments?
Looking at NUS’s US$402m in current liabilities, it appears that the company has been able to meet these obligations given the level of current assets of US$748m, with a current ratio of 1.86x. The current ratio is calculated by dividing current assets by current liabilities. Generally, for Personal Products companies, this is a reasonable ratio since there is a bit of a cash buffer without leaving too much capital in a low-return environment.
Is NUS’s debt level acceptable?
NUS is a relatively highly levered company with a debt-to-equity of 49%. This is somewhat unusual for small-caps companies, since lenders are often hesitant to provide attractive interest rates to less-established businesses. We can check to see whether NUS is able to meet its debt obligations by looking at the net interest coverage ratio. A company generating earnings before interest and tax (EBIT) at least three times its net interest payments is considered financially sound. In NUS's, case, the ratio of 15.06x suggests that interest is comfortably covered, which means that debtors may be willing to loan the company more money, giving NUS ample headroom to grow its debt facilities.
Next Steps:
Although NUS’s debt level is towards the higher end of the spectrum, its cash flow coverage seems adequate to meet obligations which means its debt is being efficiently utilised. Since there is also no concerns around NUS's liquidity needs, this may be its optimal capital structure for the time being. This is only a rough assessment of financial health, and I'm sure NUS has company-specific issues impacting its capital structure decisions. I recommend you continue to research Nu Skin Enterprises to get a better picture of the small-cap by looking at:
Future Outlook: What are well-informed industry analysts predicting for NUS’s future growth? Take a look at our free research report of analyst consensus for NUS’s outlook.
Valuation: What is NUS worth today? Is the stock undervalued, even when its growth outlook is factored into its intrinsic value? The intrinsic value infographic in our free research report helps visualize whether NUS is currently mispriced by the market.
Other High-Performing Stocks: Are there other stocks that provide better prospects with proven track records? Explore our free list of these great stocks here.
We aim to bring you long-term focused research analysis driven by fundamental data. Note that our analysis may not factor in the latest price-sensitive company announcements or qualitative material.
If you spot an error that warrants correction, please contact the editor at editorial-team@simplywallst.com. This article by Simply Wall St is general in nature. It does not constitute a recommendation to buy or sell any stock, and does not take account of your objectives, or your financial situation. Simply Wall St has no position in the stocks mentioned. Thank you for reading.

