Should You Like NVE Corporation’s (NASDAQ:NVEC) High Return On Capital Employed?

Today we'll look at NVE Corporation (NASDAQ:NVEC) and reflect on its potential as an investment. Specifically, we're going to calculate its Return On Capital Employed (ROCE), in the hopes of getting some insight into the business.
First, we'll go over how we calculate ROCE. Next, we'll compare it to others in its industry. Finally, we'll look at how its current liabilities affect its ROCE.
What is Return On Capital Employed (ROCE)?
ROCE is a metric for evaluating how much pre-tax income (in percentage terms) a company earns on the capital invested in its business. In general, businesses with a higher ROCE are usually better quality. In brief, it is a useful tool, but it is not without drawbacks. Renowned investment researcher Michael Mauboussin has suggested that a high ROCE can indicate that 'one dollar invested in the company generates value of more than one dollar'.
So, How Do We Calculate ROCE?
Analysts use this formula to calculate return on capital employed:
Return on Capital Employed = Earnings Before Interest and Tax (EBIT) ÷ (Total Assets - Current Liabilities)
Or for NVE:
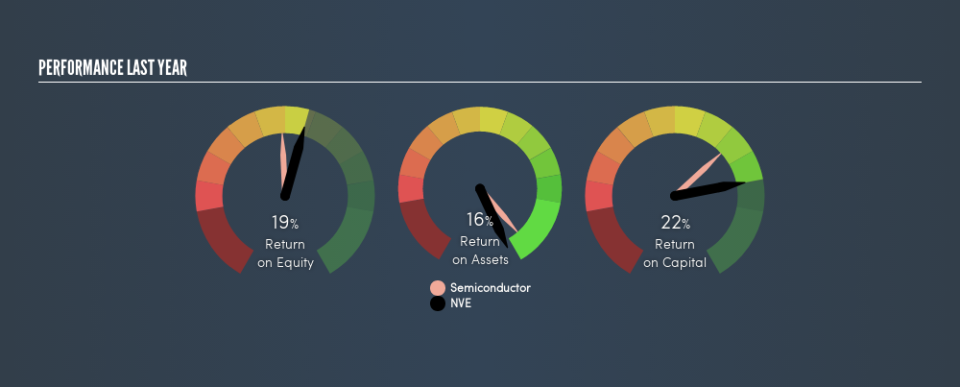
0.22 = US$18m ÷ (US$85m - US$866k) (Based on the trailing twelve months to December 2018.)
Therefore, NVE has an ROCE of 22%.
See our latest analysis for NVE
Is NVE's ROCE Good?
When making comparisons between similar businesses, investors may find ROCE useful. In our analysis, NVE's ROCE is meaningfully higher than the 12% average in the Semiconductor industry. We would consider this a positive, as it suggests it is using capital more effectively than other similar companies. Regardless of the industry comparison, in absolute terms, NVE's ROCE currently appears to be excellent.
When considering this metric, keep in mind that it is backwards looking, and not necessarily predictive. Companies in cyclical industries can be difficult to understand using ROCE, as returns typically look high during boom times, and low during busts. ROCE is only a point-in-time measure. If NVE is cyclical, it could make sense to check out this free graph of past earnings, revenue and cash flow.
NVE's Current Liabilities And Their Impact On Its ROCE
Current liabilities are short term bills and invoices that need to be paid in 12 months or less. Due to the way the ROCE equation works, having large bills due in the near term can make it look as though a company has less capital employed, and thus a higher ROCE than usual. To counter this, investors can check if a company has high current liabilities relative to total assets.
NVE has total assets of US$85m and current liabilities of US$866k. As a result, its current liabilities are equal to approximately 1.0% of its total assets. NVE has low current liabilities, which have a negligible impact on its relatively good ROCE.
The Bottom Line On NVE's ROCE
This is an attractive combination and suggests the company could have potential. NVE shapes up well under this analysis, but it is far from the only business delivering excellent numbers . You might also want to check this free collection of companies delivering excellent earnings growth.
If you are like me, then you will not want to miss this free list of growing companies that insiders are buying.
We aim to bring you long-term focused research analysis driven by fundamental data. Note that our analysis may not factor in the latest price-sensitive company announcements or qualitative material.
If you spot an error that warrants correction, please contact the editor at editorial-team@simplywallst.com. This article by Simply Wall St is general in nature. It does not constitute a recommendation to buy or sell any stock, and does not take account of your objectives, or your financial situation. Simply Wall St has no position in the stocks mentioned. Thank you for reading.

