What Is nVent Electric's (NYSE:NVT) P/E Ratio After Its Share Price Tanked?
To the annoyance of some shareholders, nVent Electric (NYSE:NVT) shares are down a considerable 51% in the last month. Indeed the recent decline has arguably caused some bitterness for shareholders who have held through the 47% drop over twelve months.
All else being equal, a share price drop should make a stock more attractive to potential investors. While the market sentiment towards a stock is very changeable, in the long run, the share price will tend to move in the same direction as earnings per share. So, on certain occasions, long term focussed investors try to take advantage of pessimistic expectations to buy shares at a better price. One way to gauge market expectations of a stock is to look at its Price to Earnings Ratio (PE Ratio). A high P/E ratio means that investors have a high expectation about future growth, while a low P/E ratio means they have low expectations about future growth.
See our latest analysis for nVent Electric
How Does nVent Electric's P/E Ratio Compare To Its Peers?
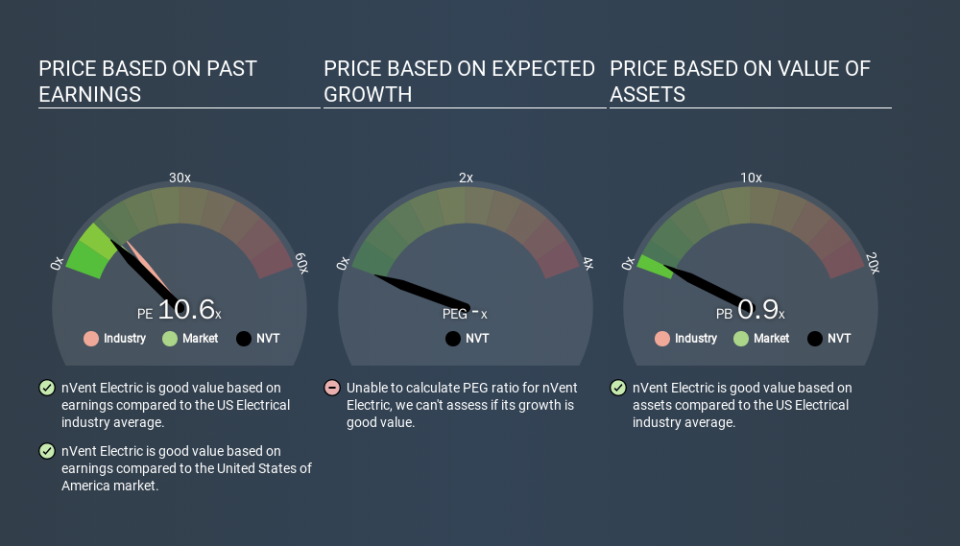
nVent Electric's P/E of 10.63 indicates relatively low sentiment towards the stock. The image below shows that nVent Electric has a lower P/E than the average (13.6) P/E for companies in the electrical industry.
nVent Electric's P/E tells us that market participants think it will not fare as well as its peers in the same industry. Many investors like to buy stocks when the market is pessimistic about their prospects. It is arguably worth checking if insiders are buying shares, because that might imply they believe the stock is undervalued.
How Growth Rates Impact P/E Ratios
Companies that shrink earnings per share quickly will rapidly decrease the 'E' in the equation. Therefore, even if you pay a low multiple of earnings now, that multiple will become higher in the future. So while a stock may look cheap based on past earnings, it could be expensive based on future earnings.
nVent Electric's earnings per share were pretty steady over the last year. And EPS is down 3.6% a year, over the last 3 years. So we might expect a relatively low P/E.
Don't Forget: The P/E Does Not Account For Debt or Bank Deposits
One drawback of using a P/E ratio is that it considers market capitalization, but not the balance sheet. So it won't reflect the advantage of cash, or disadvantage of debt. Hypothetically, a company could reduce its future P/E ratio by spending its cash (or taking on debt) to achieve higher earnings.
While growth expenditure doesn't always pay off, the point is that it is a good option to have; but one that the P/E ratio ignores.
nVent Electric's Balance Sheet
Net debt is 40% of nVent Electric's market cap. While that's enough to warrant consideration, it doesn't really concern us.
The Bottom Line On nVent Electric's P/E Ratio
nVent Electric's P/E is 10.6 which is below average (11.5) in the US market. EPS grew over the last twelve months, and debt levels are quite reasonable. The P/E ratio implies the market is cautious about longer term prospects. Given nVent Electric's P/E ratio has declined from 21.9 to 10.6 in the last month, we know for sure that the market is significantly less confident about the business today, than it was back then. For those who don't like to trade against momentum, that could be a warning sign, but a contrarian investor might want to take a closer look.
Investors should be looking to buy stocks that the market is wrong about. If the reality for a company is not as bad as the P/E ratio indicates, then the share price should increase as the market realizes this. So this free visualization of the analyst consensus on future earnings could help you make the right decision about whether to buy, sell, or hold.
You might be able to find a better buy than nVent Electric. If you want a selection of possible winners, check out this free list of interesting companies that trade on a P/E below 20 (but have proven they can grow earnings).
If you spot an error that warrants correction, please contact the editor at editorial-team@simplywallst.com. This article by Simply Wall St is general in nature. It does not constitute a recommendation to buy or sell any stock, and does not take account of your objectives, or your financial situation. Simply Wall St has no position in the stocks mentioned.
We aim to bring you long-term focused research analysis driven by fundamental data. Note that our analysis may not factor in the latest price-sensitive company announcements or qualitative material. Thank you for reading.

