NZD/USD Forex Technical Analysis – Sustained Move Over .7145 Targets .7204 – .7266 Retracement Zone
The New Zealand Dollar is trading at its highest level since March 22 on Thursday as the U.S. Dollar continued to weaken in response to the pullback in U.S. bond yields with investors seemingly accepting the Federal Reserve’s arguments that interest rates will remain at historically low levels for a long time.
At 10:26 GMT, the NZD/USD is trading .7165, up 0.0026 or +0.36%.
In other news, the Reserve Bank of New Zealand (RBNZ) on Wednesday reiterated its commitment to being patient on policy and keeping rates at 0.25% for a prolonged period. That left yields on 10-year bonds near their lowest in two weeks at 1.720%, with a hike not priced until late next year.
Daily Swing Chart Technical Analysis
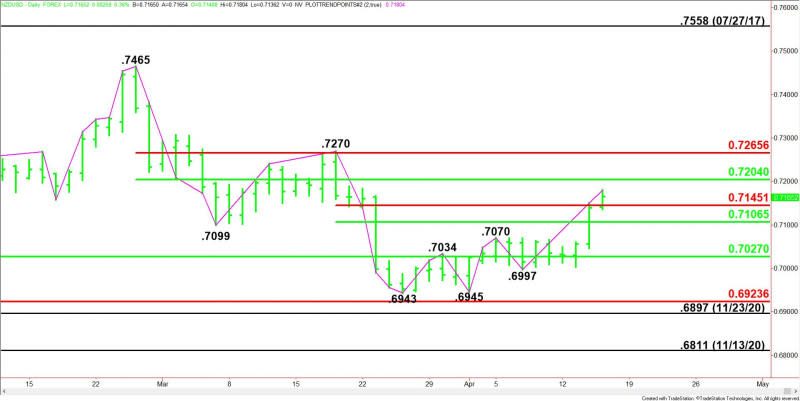
The main trend is up according to the daily swing chart. The uptrend was reaffirmed earlier today when buyers took out yesterday’s high. A move through the intraday high at .7180 will indicate the buying is getting stronger. The main trend will change to down on a trade through .6997.
The major support is the retracement zone at .7027 to .6924. This zone stopped the selling at .6945 and .6943. This area is also controlling the near-term direction of the Forex pair.
The short-term range is .7270 to .6943. The NZD/USD is currently trading on the strong side of its retracement zone at .7145 to .7106, making it support.
The main range is .7465 to .6943. Its retracement zone at .7204 to .7266 is the primary upside target. Sellers could come in on the first test of this area.
Daily Swing Chart Technical Forecast
The direction of the NZD/USD on Thursday is likely to be determined by trader reaction to the short-term Fibonacci level at .7145.
Bullish Scenario
A sustained move over .7145 will indicate the presence of buyers. If this creates enough upside momentum today then look for the buying to possibly extend into the main 50% level at .7204. Look for sellers on the first test.
Overcoming .7204 will indicate the buying is getting stronger. This could trigger a surge into the potential resistance cluster at .7266 to .7270. Watch for sellers again. Taking out .7270 could trigger an acceleration to the upside.
Bearish Scenario
A sustained move under .7145 will signal the presence of sellers. The first downside target is .7106. Since the main trend is up, buyers could come in on the first test of this level. Look for an acceleration to the downside if .7106 fails as support. This could trigger a further break into .7027.
For a look at all of today’s economic events, check out our economic calendar.
This article was originally posted on FX Empire

