Do You Like Ober SA (EPA:ALOBR) At This P/E Ratio?

This article is written for those who want to get better at using price to earnings ratios (P/E ratios). To keep it practical, we'll show how Ober SA's (EPA:ALOBR) P/E ratio could help you assess the value on offer. Based on the last twelve months, Ober's P/E ratio is 15.98. That means that at current prices, buyers pay €15.98 for every €1 in trailing yearly profits.
Check out our latest analysis for Ober
How Do I Calculate A Price To Earnings Ratio?
The formula for price to earnings is:
Price to Earnings Ratio = Price per Share ÷ Earnings per Share (EPS)
Or for Ober:
P/E of 15.98 = EUR9.80 ÷ EUR0.61 (Based on the trailing twelve months to June 2019.)
Is A High P/E Ratio Good?
A higher P/E ratio means that investors are paying a higher price for each EUR1 of company earnings. All else being equal, it's better to pay a low price -- but as Warren Buffett said, 'It's far better to buy a wonderful company at a fair price than a fair company at a wonderful price'.
Does Ober Have A Relatively High Or Low P/E For Its Industry?
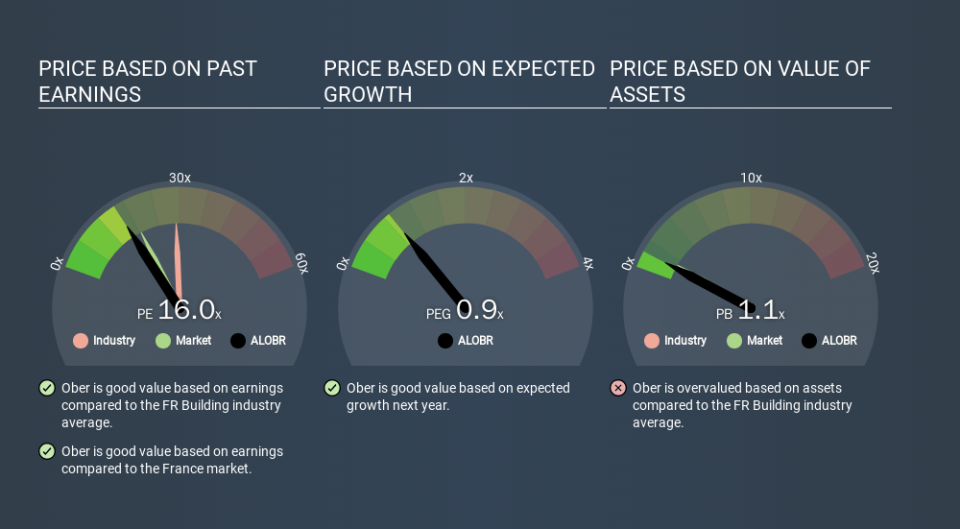
The P/E ratio essentially measures market expectations of a company. The image below shows that Ober has a lower P/E than the average (29.0) P/E for companies in the building industry.
Ober's P/E tells us that market participants think it will not fare as well as its peers in the same industry. Many investors like to buy stocks when the market is pessimistic about their prospects. If you consider the stock interesting, further research is recommended. For example, I often monitor director buying and selling.
How Growth Rates Impact P/E Ratios
If earnings fall then in the future the 'E' will be lower. That means even if the current P/E is low, it will increase over time if the share price stays flat. A higher P/E should indicate the stock is expensive relative to others -- and that may encourage shareholders to sell.
Ober's earnings per share were pretty steady over the last year. And over the longer term (3 years) earnings per share have decreased 4.8% annually. So we might expect a relatively low P/E.
Remember: P/E Ratios Don't Consider The Balance Sheet
It's important to note that the P/E ratio considers the market capitalization, not the enterprise value. So it won't reflect the advantage of cash, or disadvantage of debt. In theory, a company can lower its future P/E ratio by using cash or debt to invest in growth.
Such spending might be good or bad, overall, but the key point here is that you need to look at debt to understand the P/E ratio in context.
So What Does Ober's Balance Sheet Tell Us?
Ober has net debt worth 87% of its market capitalization. If you want to compare its P/E ratio to other companies, you should absolutely keep in mind it has significant borrowings.
The Bottom Line On Ober's P/E Ratio
Ober trades on a P/E ratio of 16.0, which is below the FR market average of 18.5. While the recent EPS growth is a positive, the significant amount of debt on the balance sheet may be contributing to pessimistic market expectations.
Investors have an opportunity when market expectations about a stock are wrong. As value investor Benjamin Graham famously said, 'In the short run, the market is a voting machine but in the long run, it is a weighing machine. So this free visualization of the analyst consensus on future earnings could help you make the right decision about whether to buy, sell, or hold.
Of course you might be able to find a better stock than Ober. So you may wish to see this free collection of other companies that have grown earnings strongly.
If you spot an error that warrants correction, please contact the editor at editorial-team@simplywallst.com. This article by Simply Wall St is general in nature. It does not constitute a recommendation to buy or sell any stock, and does not take account of your objectives, or your financial situation. Simply Wall St has no position in the stocks mentioned.
We aim to bring you long-term focused research analysis driven by fundamental data. Note that our analysis may not factor in the latest price-sensitive company announcements or qualitative material. Thank you for reading.
