Is OCI International Holdings Limited’s (HKG:329) Balance Sheet A Threat To Its Future?

While small-cap stocks, such as OCI International Holdings Limited (HKG:329) with its market cap of HK$1.5b, are popular for their explosive growth, investors should also be aware of their balance sheet to judge whether the company can survive a downturn. Evaluating financial health as part of your investment thesis is essential, since poor capital management may bring about bankruptcies, which occur at a higher rate for small-caps. Here are few basic financial health checks you should consider before taking the plunge. Though, given that I have not delve into the company-specifics, I recommend you dig deeper yourself into 329 here.
How much cash does 329 generate through its operations?
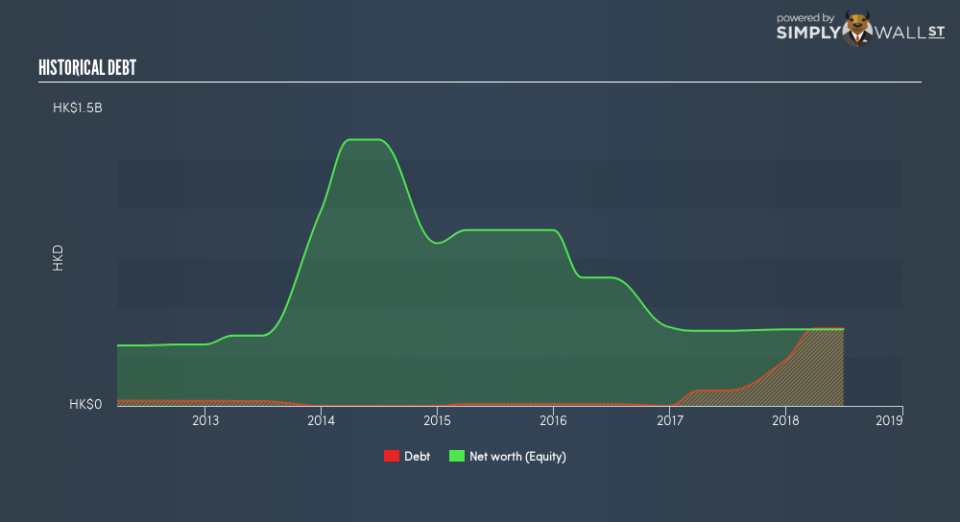
329 has built up its total debt levels in the last twelve months, from HK$78m to HK$392m made up of predominantly near term debt. With this increase in debt, 329 currently has HK$498m remaining in cash and short-term investments , ready to deploy into the business. Moving onto cash from operations, its operating cash flow is not yet significant enough to calculate a meaningful cash-to-debt ratio, indicating that operational efficiency is something we’d need to take a look at. As the purpose of this article is a high-level overview, I won’t be looking at this today, but you can assess some of 329’s operating efficiency ratios such as ROA here.
Can 329 pay its short-term liabilities?
Looking at 329’s HK$420m in current liabilities, the company has maintained a safe level of current assets to meet its obligations, with the current ratio last standing at 1.55x. Usually, for Retail Distributors companies, this is a suitable ratio as there’s enough of a cash buffer without holding too much capital in low return investments.
Is 329’s debt level acceptable?
329 is a highly-leveraged company with debt exceeding equity by over 100%. This is not unusual for small-caps as debt tends to be a cheaper and faster source of funding for some businesses. We can test if 329’s debt levels are sustainable by measuring interest payments against earnings of a company. Ideally, earnings before interest and tax (EBIT) should cover net interest by at least three times. For 329, the ratio of 1.71x suggests that interest is not strongly covered, which means that debtors may be less inclined to loan the company more money, reducing its headroom for growth through debt.
Next Steps:
Although 329’s debt level is towards the higher end of the spectrum, its cash flow coverage seems adequate to meet obligations which means its debt is being efficiently utilised. This may mean this is an optimal capital structure for the business, given that it is also meeting its short-term commitment. I admit this is a fairly basic analysis for 329’s financial health. Other important fundamentals need to be considered alongside. I suggest you continue to research OCI International Holdings to get a better picture of the small-cap by looking at:
Historical Performance: What has 329’s returns been like over the past? Go into more detail in the past track record analysis and take a look at the free visual representations of our analysis for more clarity.
Other High-Performing Stocks: Are there other stocks that provide better prospects with proven track records? Explore our free list of these great stocks here.
To help readers see past the short term volatility of the financial market, we aim to bring you a long-term focused research analysis purely driven by fundamental data. Note that our analysis does not factor in the latest price-sensitive company announcements.
The author is an independent contributor and at the time of publication had no position in the stocks mentioned. For errors that warrant correction please contact the editor at editorial-team@simplywallst.com.

