Update: Oma Säästöpankki Oyj (HEL:OMASP) Stock Gained 20% In The Last Year

These days it's easy to simply buy an index fund, and your returns should (roughly) match the market. But if you pick the right individual stocks, you could make more than that. For example, the Oma Säästöpankki Oyj (HEL:OMASP) share price is up 20% in the last year, clearly besting the market return of around 5.4% (not including dividends). If it can keep that out-performance up over the long term, investors will do very well! We'll need to follow Oma Säästöpankki Oyj for a while to get a better sense of its share price trend, since it hasn't been listed for particularly long.
View our latest analysis for Oma Säästöpankki Oyj
While markets are a powerful pricing mechanism, share prices reflect investor sentiment, not just underlying business performance. One imperfect but simple way to consider how the market perception of a company has shifted is to compare the change in the earnings per share (EPS) with the share price movement.
During the last year, Oma Säästöpankki Oyj actually saw its earnings per share drop 7.7%.
This means it's unlikely the market is judging the company based on earnings growth. Since the change in EPS doesn't seem to correlate with the change in share price, it's worth taking a look at other metrics.
We doubt the modest 1.6% dividend yield is doing much to support the share price. However the year on year revenue growth of 6.6% would help. Many businesses do go through a faze where they have to forgo some profits to drive business development, and sometimes its for the best.
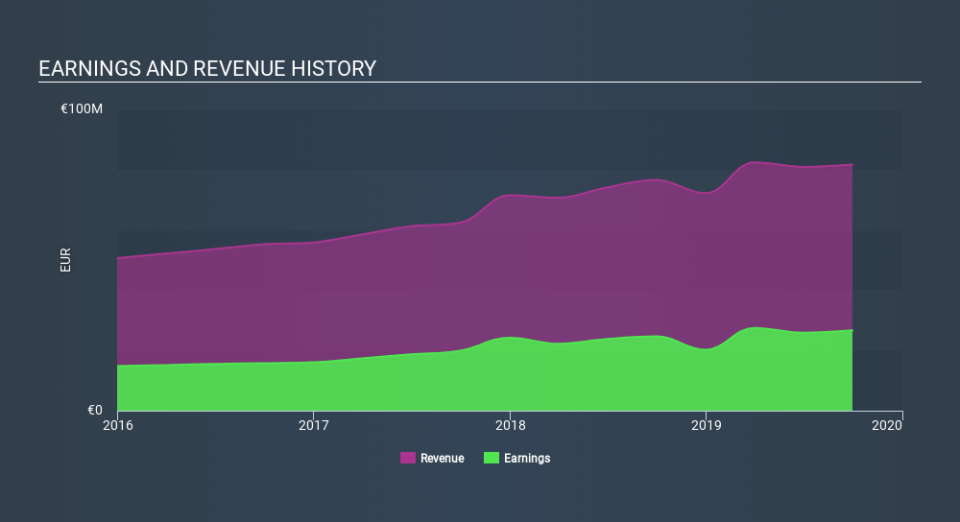
The image below shows how earnings and revenue have tracked over time (if you click on the image you can see greater detail).
Balance sheet strength is crucial. It might be well worthwhile taking a look at our free report on how its financial position has changed over time.
What About Dividends?
When looking at investment returns, it is important to consider the difference between total shareholder return (TSR) and share price return. The TSR is a return calculation that accounts for the value of cash dividends (assuming that any dividend received was reinvested) and the calculated value of any discounted capital raisings and spin-offs. So for companies that pay a generous dividend, the TSR is often a lot higher than the share price return. As it happens, Oma Säästöpankki Oyj's TSR for the last year was 22%, which exceeds the share price return mentioned earlier. This is largely a result of its dividend payments!
A Different Perspective
It's nice to see that Oma Säästöpankki Oyj shareholders have gained 22% over the last year , including dividends . A substantial portion of that gain has come in the last three months, with the stock up 24% in that time. Demand for the stock from multiple parties is pushing the price higher; it could be that word is getting out about its virtues as a business. Is Oma Säästöpankki Oyj cheap compared to other companies? These 3 valuation measures might help you decide.
We will like Oma Säästöpankki Oyj better if we see some big insider buys. While we wait, check out this free list of growing companies with considerable, recent, insider buying.
Please note, the market returns quoted in this article reflect the market weighted average returns of stocks that currently trade on FI exchanges.
If you spot an error that warrants correction, please contact the editor at editorial-team@simplywallst.com. This article by Simply Wall St is general in nature. It does not constitute a recommendation to buy or sell any stock, and does not take account of your objectives, or your financial situation. Simply Wall St has no position in the stocks mentioned.
We aim to bring you long-term focused research analysis driven by fundamental data. Note that our analysis may not factor in the latest price-sensitive company announcements or qualitative material. Thank you for reading.
