Omni Bridgeway (ASX:OBL) delivers shareholders splendid 19% CAGR over 5 years, surging 5.8% in the last week alone
When you buy a stock there is always a possibility that it could drop 100%. But on the bright side, you can make far more than 100% on a really good stock. Long term Omni Bridgeway Limited (ASX:OBL) shareholders would be well aware of this, since the stock is up 128% in five years. It's also good to see the share price up 40% over the last quarter. The company reported its financial results recently; you can catch up on the latest numbers by reading our company report.
On the back of a solid 7-day performance, let's check what role the company's fundamentals have played in driving long term shareholder returns.
View our latest analysis for Omni Bridgeway
Omni Bridgeway isn't currently profitable, so most analysts would look to revenue growth to get an idea of how fast the underlying business is growing. Shareholders of unprofitable companies usually expect strong revenue growth. That's because fast revenue growth can be easily extrapolated to forecast profits, often of considerable size.
In the last 5 years Omni Bridgeway saw its revenue grow at 4.3% per year. Put simply, that growth rate fails to impress. So we wouldn't have expected to see the share price to have lifted 18% for each year during that time, but that's what happened. Shareholders should be pretty happy with that, although interested investors might want to examine the financial data more closely to see if the gains are really justified. It may be that the market is pretty optimistic about Omni Bridgeway.
You can see how earnings and revenue have changed over time in the image below (click on the chart to see the exact values).
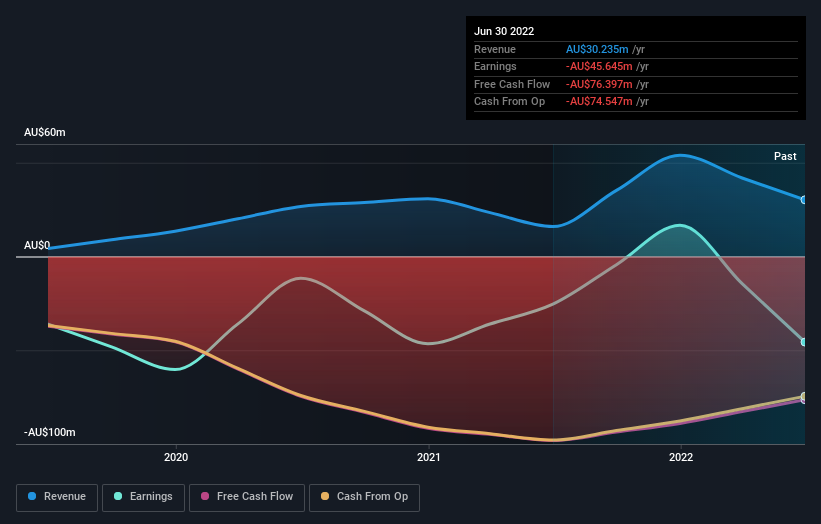
We like that insiders have been buying shares in the last twelve months. Even so, future earnings will be far more important to whether current shareholders make money. This free report showing analyst forecasts should help you form a view on Omni Bridgeway
What About The Total Shareholder Return (TSR)?
We'd be remiss not to mention the difference between Omni Bridgeway's total shareholder return (TSR) and its share price return. Arguably the TSR is a more complete return calculation because it accounts for the value of dividends (as if they were reinvested), along with the hypothetical value of any discounted capital that have been offered to shareholders. Dividends have been really beneficial for Omni Bridgeway shareholders, and that cash payout contributed to why its TSR of 140%, over the last 5 years, is better than the share price return.
A Different Perspective
It's nice to see that Omni Bridgeway shareholders have received a total shareholder return of 7.5% over the last year. However, that falls short of the 19% TSR per annum it has made for shareholders, each year, over five years. Potential buyers might understandably feel they've missed the opportunity, but it's always possible business is still firing on all cylinders. It's always interesting to track share price performance over the longer term. But to understand Omni Bridgeway better, we need to consider many other factors. Consider for instance, the ever-present spectre of investment risk. We've identified 2 warning signs with Omni Bridgeway (at least 1 which doesn't sit too well with us) , and understanding them should be part of your investment process.
Omni Bridgeway is not the only stock that insiders are buying. For those who like to find winning investments this free list of growing companies with recent insider purchasing, could be just the ticket.
Please note, the market returns quoted in this article reflect the market weighted average returns of stocks that currently trade on AU exchanges.
Have feedback on this article? Concerned about the content? Get in touch with us directly. Alternatively, email editorial-team (at) simplywallst.com.
This article by Simply Wall St is general in nature. We provide commentary based on historical data and analyst forecasts only using an unbiased methodology and our articles are not intended to be financial advice. It does not constitute a recommendation to buy or sell any stock, and does not take account of your objectives, or your financial situation. We aim to bring you long-term focused analysis driven by fundamental data. Note that our analysis may not factor in the latest price-sensitive company announcements or qualitative material. Simply Wall St has no position in any stocks mentioned.
Join A Paid User Research Session
You’ll receive a US$30 Amazon Gift card for 1 hour of your time while helping us build better investing tools for the individual investors like yourself. Sign up here

