Here’s What Omnicell, Inc.’s (NASDAQ:OMCL) P/E Is Telling Us

This article is for investors who would like to improve their understanding of price to earnings ratios (P/E ratios). We’ll show how you can use Omnicell, Inc.’s (NASDAQ:OMCL) P/E ratio to inform your assessment of the investment opportunity. Omnicell has a price to earnings ratio of 83.18, based on the last twelve months. In other words, at today’s prices, investors are paying $83.18 for every $1 in prior year profit.
Check out our latest analysis for Omnicell
Want to participate in a research study? Help shape the future of investing tools and earn a $60 gift card!
How Do I Calculate A Price To Earnings Ratio?
The formula for P/E is:
Price to Earnings Ratio = Price per Share ÷ Earnings per Share (EPS)
Or for Omnicell:
P/E of 83.18 = $79.97 ÷ $0.96 (Based on the trailing twelve months to December 2018.)
Is A High Price-to-Earnings Ratio Good?
A higher P/E ratio implies that investors pay a higher price for the earning power of the business. That is not a good or a bad thing per se, but a high P/E does imply buyers are optimistic about the future.
How Growth Rates Impact P/E Ratios
Earnings growth rates have a big influence on P/E ratios. Earnings growth means that in the future the ‘E’ will be higher. That means even if the current P/E is high, it will reduce over time if the share price stays flat. So while a stock may look expensive based on past earnings, it could be cheap based on future earnings.
Most would be impressed by Omnicell earnings growth of 18% in the last year. And it has improved its earnings per share by 32% per year over the last three years. So one might expect an above average P/E ratio. In contrast, EPS has decreased by 4.3%, annually, over 5 years.
How Does Omnicell’s P/E Ratio Compare To Its Peers?
We can get an indication of market expectations by looking at the P/E ratio. The image below shows that Omnicell has a P/E ratio that is roughly in line with the healthcare services industry average (80.2).
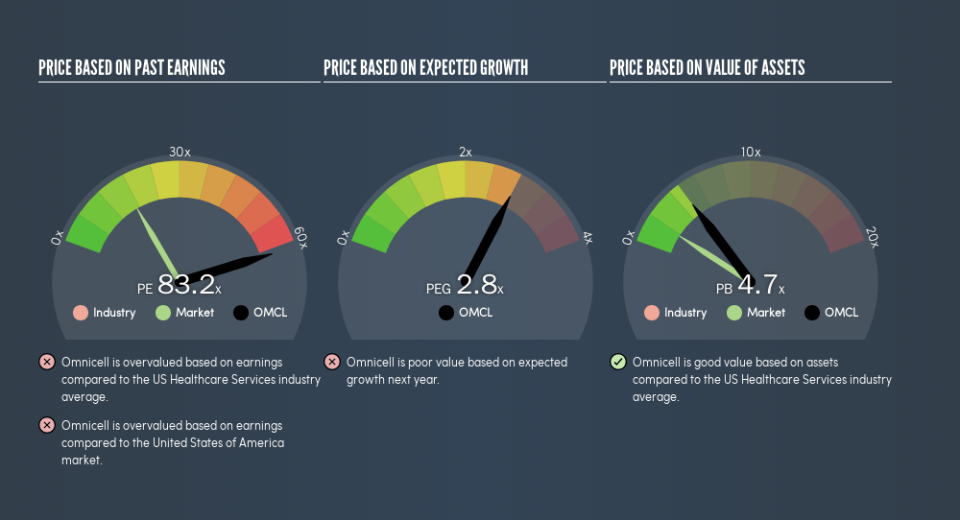
Its P/E ratio suggests that Omnicell shareholders think that in the future it will perform about the same as other companies in its industry classification. If the company has better than average prospects, then the market might be underestimating it. Checking factors such as the tenure of the board and management could help you form your own view on if that will happen.
Don’t Forget: The P/E Does Not Account For Debt or Bank Deposits
It’s important to note that the P/E ratio considers the market capitalization, not the enterprise value. In other words, it does not consider any debt or cash that the company may have on the balance sheet. Theoretically, a business can improve its earnings (and produce a lower P/E in the future), by taking on debt (or spending its remaining cash).
Such expenditure might be good or bad, in the long term, but the point here is that the balance sheet is not reflected by this ratio.
Omnicell’s Balance Sheet
Omnicell has net debt worth just 2.1% of its market capitalization. So it doesn’t have as many options as it would with net cash, but its debt would not have much of an impact on its P/E ratio.
The Verdict On Omnicell’s P/E Ratio
Omnicell trades on a P/E ratio of 83.2, which is multiples above the US market average of 17.2. The company is not overly constrained by its modest debt levels, and it is growing earnings per share. So it does not seem strange that the P/E is above average.
Investors should be looking to buy stocks that the market is wrong about. As value investor Benjamin Graham famously said, ‘In the short run, the market is a voting machine but in the long run, it is a weighing machine.’ So this free report on the analyst consensus forecasts could help you make a master move on this stock.
You might be able to find a better buy than Omnicell. If you want a selection of possible winners, check out this free list of interesting companies that trade on a P/E below 20 (but have proven they can grow earnings).
We aim to bring you long-term focused research analysis driven by fundamental data. Note that our analysis may not factor in the latest price-sensitive company announcements or qualitative material.
If you spot an error that warrants correction, please contact the editor at editorial-team@simplywallst.com. This article by Simply Wall St is general in nature. It does not constitute a recommendation to buy or sell any stock, and does not take account of your objectives, or your financial situation. Simply Wall St has no position in the stocks mentioned. Thank you for reading.

