One Metric To Rule Them All: Aventus Group (ASX:AVN)

Want to participate in a short research study? Help shape the future of investing tools and you could win a $250 gift card!
Aventus Group is a AU$1.3b small-cap, real estate investment trust (REIT) based in Sydney, Australia. REITs are basically a portfolio of income-producing real estate investments, which are owned and operated by management of that trust company. They have to meet certain requirements in order to become a REIT, meaning they should be analyzed a different way. In this commentary, I'll take you through some of the things I look at when assessing AVN.
Check out our latest analysis for Aventus Group
Funds from Operations (FFO) is a higher quality measure of AVN's earnings compared to net income. This term is very common in the REIT investing world as it provides a cleaner look at its cash flow from daily operations by excluding impact of one-off activities or non-cash items such as depreciation. For AVN, its FFO of AU$88m makes up 78% of its gross profit, which means the majority of its earnings are high-quality and recurring.
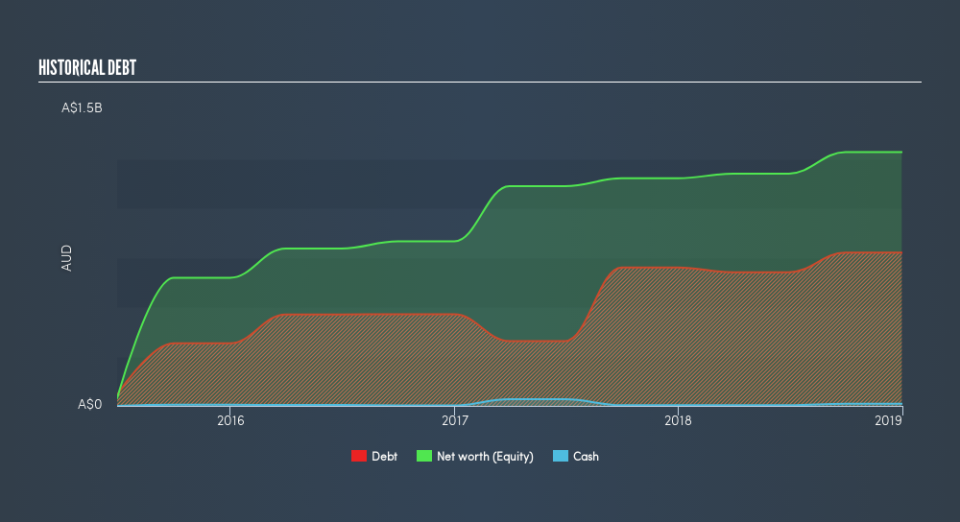
In order to understand whether AVN has a healthy balance sheet, we have to look at a metric called FFO-to-total debt. This tells us how long it will take AVN to pay off its debt using its income from its main business activities, and gives us an insight into AVN’s ability to service its borrowings. With a ratio of 13%, the credit rating agency Standard & Poor would consider this as significantly high risk. This would take AVN 8 years to pay off using just operating income, which is a long time, and risk increases with time. But realistically, companies have many levers to pull in order to pay back their debt, beyond operating income alone.
Next, interest coverage ratio shows how many times AVN’s earnings can cover its annual interest payments. Usually the ratio is calculated using EBIT, but for REITs, it’s better to use FFO divided by net interest. This is similar to the above concept, but looks at the nearer-term obligations. With an interest coverage ratio of 3.49x, it’s safe to say AVN is generating an appropriate amount of cash from its borrowings.
I also use FFO to look at AVN's valuation relative to other REITs in Australia by using the price-to-FFO metric. This is conceptually the same as the price-to-earnings (PE) ratio, but as previously mentioned, FFO is more suitable. AVN's price-to-FFO is 14.3x, compared to the long-term industry average of 16.5x, meaning that it is slightly undervalued.
Next Steps:
As a REIT, Aventus Group offers some unique characteristics which could help diversify your portfolio. However, before you decide on whether or not to invest in AVN, I highly recommend taking a look at other aspects of the stock to consider:
Future Outlook: What are well-informed industry analysts predicting for AVN’s future growth? Take a look at our free research report of analyst consensus for AVN’s outlook.
Valuation: What is AVN worth today? Is the stock undervalued, even when its growth outlook is factored into its intrinsic value? The intrinsic value infographic in our free research report helps visualize whether AVN is currently mispriced by the market.
Other High-Performing Stocks: Are there other stocks that provide better prospects with proven track records? Explore our free list of these great stocks here.
We aim to bring you long-term focused research analysis driven by fundamental data. Note that our analysis may not factor in the latest price-sensitive company announcements or qualitative material.
If you spot an error that warrants correction, please contact the editor at editorial-team@simplywallst.com. This article by Simply Wall St is general in nature. It does not constitute a recommendation to buy or sell any stock, and does not take account of your objectives, or your financial situation. Simply Wall St has no position in the stocks mentioned. Thank you for reading.

