OneAll International Limited (ASX:1AL) Delivered A Better ROE Than Its Industry

While some investors are already well versed in financial metrics (hat tip), this article is for those who would like to learn about Return On Equity (ROE) and why it is important. By way of learning-by-doing, we'll look at ROE to gain a better understanding of OneAll International Limited (ASX:1AL).
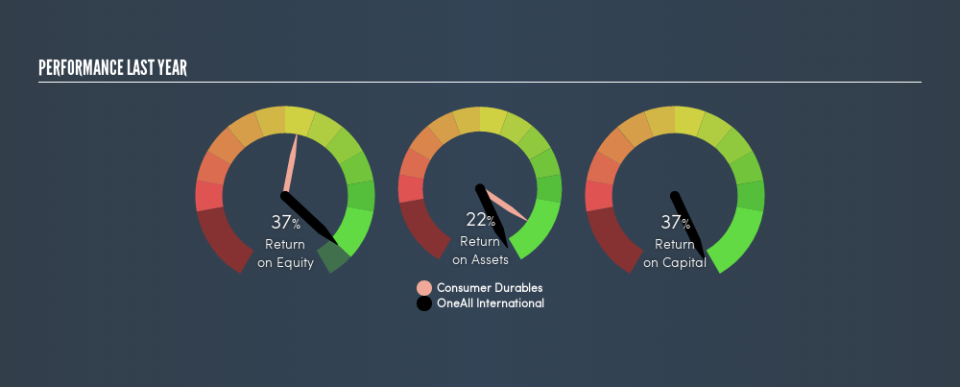
Over the last twelve months OneAll International has recorded a ROE of 37%. One way to conceptualize this, is that for each A$1 of shareholders' equity it has, the company made A$0.37 in profit.
Want to participate in a short research study? Help shape the future of investing tools and you could win a $250 gift card!
View our latest analysis for OneAll International
How Do You Calculate Return On Equity?
The formula for return on equity is:
Return on Equity = Net Profit ÷ Shareholders' Equity
Or for OneAll International:
37% = AU$9.2m ÷ AU$25m (Based on the trailing twelve months to December 2018.)
Most know that net profit is the total earnings after all expenses, but the concept of shareholders' equity is a little more complicated. It is all the money paid into the company from shareholders, plus any earnings retained. You can calculate shareholders' equity by subtracting the company's total liabilities from its total assets.
What Does ROE Signify?
ROE looks at the amount a company earns relative to the money it has kept within the business. The 'return' is the profit over the last twelve months. A higher profit will lead to a higher ROE. So, all else being equal, a high ROE is better than a low one. Clearly, then, one can use ROE to compare different companies.
Does OneAll International Have A Good Return On Equity?
By comparing a company's ROE with its industry average, we can get a quick measure of how good it is. The limitation of this approach is that some companies are quite different from others, even within the same industry classification. As you can see in the graphic below, OneAll International has a higher ROE than the average (18%) in the Consumer Durables industry.
That's clearly a positive. I usually take a closer look when a company has a better ROE than industry peers. For example you might check if insiders are buying shares.
How Does Debt Impact ROE?
Virtually all companies need money to invest in the business, to grow profits. That cash can come from retained earnings, issuing new shares (equity), or debt. In the case of the first and second options, the ROE will reflect this use of cash, for growth. In the latter case, the debt used for growth will improve returns, but won't affect the total equity. Thus the use of debt can improve ROE, albeit along with extra risk in the case of stormy weather, metaphorically speaking.
Combining OneAll International's Debt And Its 37% Return On Equity
OneAll International has a debt to equity ratio of 0.44, which is far from excessive. The combination of modest debt and a very impressive ROE does suggest that the business is high quality. Judicious use of debt to improve returns can certainly be a good thing, although it does elevate risk slightly and reduce future optionality.
The Key Takeaway
Return on equity is one way we can compare the business quality of different companies. In my book the highest quality companies have high return on equity, despite low debt. All else being equal, a higher ROE is better.
But when a business is high quality, the market often bids it up to a price that reflects this. The rate at which profits are likely to grow, relative to the expectations of profit growth reflected in the current price, must be considered, too. Check the past profit growth by OneAll International by looking at this visualization of past earnings, revenue and cash flow.
But note: OneAll International may not be the best stock to buy. So take a peek at this free list of interesting companies with high ROE and low debt.
We aim to bring you long-term focused research analysis driven by fundamental data. Note that our analysis may not factor in the latest price-sensitive company announcements or qualitative material.
If you spot an error that warrants correction, please contact the editor at editorial-team@simplywallst.com. This article by Simply Wall St is general in nature. It does not constitute a recommendation to buy or sell any stock, and does not take account of your objectives, or your financial situation. Simply Wall St has no position in the stocks mentioned. Thank you for reading.
