Do You Like Oracle Corporation (NYSE:ORCL) At This P/E Ratio?

This article is written for those who want to get better at using price to earnings ratios (P/E ratios). To keep it practical, we'll show how Oracle Corporation's (NYSE:ORCL) P/E ratio could help you assess the value on offer. Based on the last twelve months, Oracle's P/E ratio is 17.89. That is equivalent to an earnings yield of about 5.6%.
View our latest analysis for Oracle
How Do I Calculate Oracle's Price To Earnings Ratio?
The formula for price to earnings is:
Price to Earnings Ratio = Share Price ÷ Earnings per Share (EPS)
Or for Oracle:
P/E of 17.89 = $56.19 ÷ $3.14 (Based on the year to August 2019.)
Is A High Price-to-Earnings Ratio Good?
A higher P/E ratio means that investors are paying a higher price for each $1 of company earnings. All else being equal, it's better to pay a low price -- but as Warren Buffett said, 'It's far better to buy a wonderful company at a fair price than a fair company at a wonderful price.
Does Oracle Have A Relatively High Or Low P/E For Its Industry?
The P/E ratio indicates whether the market has higher or lower expectations of a company. The image below shows that Oracle has a lower P/E than the average (45.0) P/E for companies in the software industry.
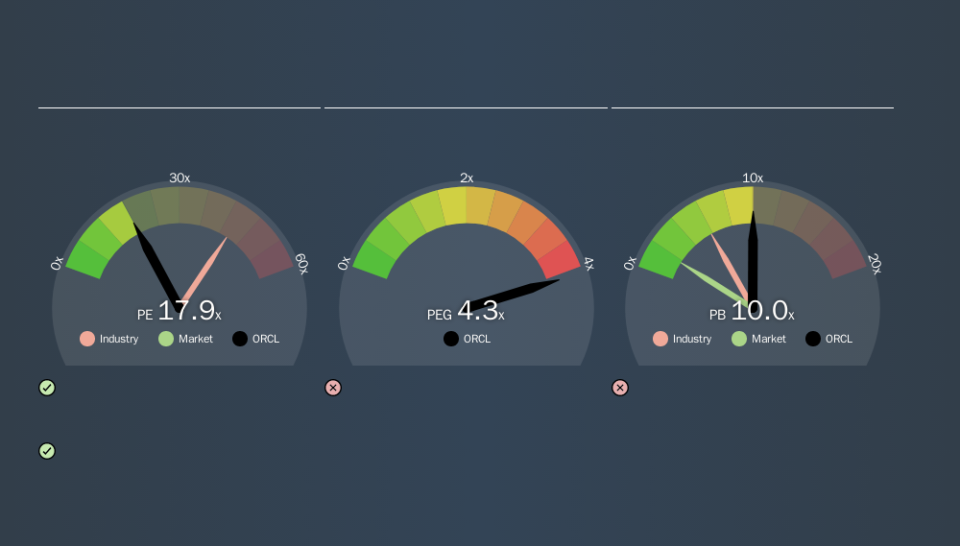
This suggests that market participants think Oracle will underperform other companies in its industry. Since the market seems unimpressed with Oracle, it's quite possible it could surprise on the upside. You should delve deeper. I like to check if company insiders have been buying or selling.
How Growth Rates Impact P/E Ratios
Earnings growth rates have a big influence on P/E ratios. That's because companies that grow earnings per share quickly will rapidly increase the 'E' in the equation. That means even if the current P/E is high, it will reduce over time if the share price stays flat. So while a stock may look expensive based on past earnings, it could be cheap based on future earnings.
Oracle's earnings made like a rocket, taking off 244% last year. Having said that, if we look back three years, EPS growth has averaged a comparatively less impressive 13%.
Don't Forget: The P/E Does Not Account For Debt or Bank Deposits
It's important to note that the P/E ratio considers the market capitalization, not the enterprise value. So it won't reflect the advantage of cash, or disadvantage of debt. In theory, a company can lower its future P/E ratio by using cash or debt to invest in growth.
Such spending might be good or bad, overall, but the key point here is that you need to look at debt to understand the P/E ratio in context.
Oracle's Balance Sheet
Oracle has net debt worth 10% of its market capitalization. This could bring some additional risk, and reduce the number of investment options for management; worth remembering if you compare its P/E to businesses without debt.
The Verdict On Oracle's P/E Ratio
Oracle has a P/E of 17.9. That's around the same as the average in the US market, which is 18.2. Given it has reasonable debt levels, and grew earnings strongly last year, the P/E indicates the market has doubts this growth can be sustained.
Investors have an opportunity when market expectations about a stock are wrong. If the reality for a company is not as bad as the P/E ratio indicates, then the share price should increase as the market realizes this. So this free visualization of the analyst consensus on future earnings could help you make the right decision about whether to buy, sell, or hold.
You might be able to find a better buy than Oracle. If you want a selection of possible winners, check out this free list of interesting companies that trade on a P/E below 20 (but have proven they can grow earnings).
We aim to bring you long-term focused research analysis driven by fundamental data. Note that our analysis may not factor in the latest price-sensitive company announcements or qualitative material.
If you spot an error that warrants correction, please contact the editor at editorial-team@simplywallst.com. This article by Simply Wall St is general in nature. It does not constitute a recommendation to buy or sell any stock, and does not take account of your objectives, or your financial situation. Simply Wall St has no position in the stocks mentioned. Thank you for reading.
