Oricon Enterprises Limited (NSE:ORICON) Might Not Be A Great Investment

Today we are going to look at Oricon Enterprises Limited (NSE:ORICON) to see whether it might be an attractive investment prospect. Specifically, we're going to calculate its Return On Capital Employed (ROCE), in the hopes of getting some insight into the business.
First of all, we'll work out how to calculate ROCE. Next, we'll compare it to others in its industry. Finally, we'll look at how its current liabilities affect its ROCE.
Understanding Return On Capital Employed (ROCE)
ROCE measures the amount of pre-tax profits a company can generate from the capital employed in its business. In general, businesses with a higher ROCE are usually better quality. Ultimately, it is a useful but imperfect metric. Author Edwin Whiting says to be careful when comparing the ROCE of different businesses, since 'No two businesses are exactly alike.'
So, How Do We Calculate ROCE?
The formula for calculating the return on capital employed is:
Return on Capital Employed = Earnings Before Interest and Tax (EBIT) ÷ (Total Assets - Current Liabilities)
Or for Oricon Enterprises:
0.015 = ₹219m ÷ (₹18b - ₹3.4b) (Based on the trailing twelve months to March 2018.)
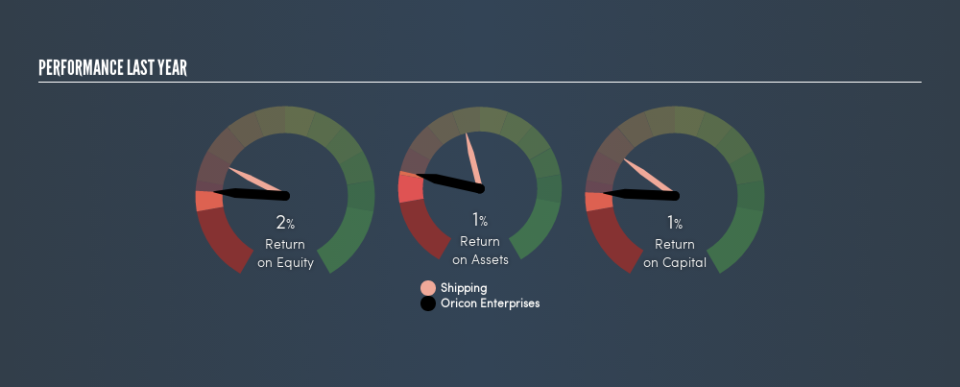
Therefore, Oricon Enterprises has an ROCE of 1.5%.
Want to participate in a short research study? Help shape the future of investing tools and you could win a $250 gift card!
View our latest analysis for Oricon Enterprises
Is Oricon Enterprises's ROCE Good?
ROCE is commonly used for comparing the performance of similar businesses. Using our data, Oricon Enterprises's ROCE appears to be significantly below the 3.4% average in the Shipping industry. This performance could be negative if sustained, as it suggests the business may underperform its industry. Regardless of how Oricon Enterprises stacks up against its industry, its ROCE in absolute terms is quite low (especially compared to a bank account). Readers may wish to look for more rewarding investments.
Oricon Enterprises's current ROCE of 1.5% is lower than its ROCE in the past, which was 5.5%, 3 years ago. So investors might consider if it has had issues recently.
Remember that this metric is backwards looking - it shows what has happened in the past, and does not accurately predict the future. ROCE can be deceptive for cyclical businesses, as returns can look incredible in boom times, and terribly low in downturns. ROCE is only a point-in-time measure. If Oricon Enterprises is cyclical, it could make sense to check out this free graph of past earnings, revenue and cash flow.
Oricon Enterprises's Current Liabilities And Their Impact On Its ROCE
Short term (or current) liabilities, are things like supplier invoices, overdrafts, or tax bills that need to be paid within 12 months. Due to the way the ROCE equation works, having large bills due in the near term can make it look as though a company has less capital employed, and thus a higher ROCE than usual. To counteract this, we check if a company has high current liabilities, relative to its total assets.
Oricon Enterprises has total liabilities of ₹3.4b and total assets of ₹18b. Therefore its current liabilities are equivalent to approximately 19% of its total assets. This is a modest level of current liabilities, which will have a limited impact on the ROCE.
Our Take On Oricon Enterprises's ROCE
That's not a bad thing, however Oricon Enterprises has a weak ROCE and may not be an attractive investment. You might be able to find a better investment than Oricon Enterprises. If you want a selection of possible winners, check out this free list of interesting companies that trade on a P/E below 20 (but have proven they can grow earnings).
If you like to buy stocks alongside management, then you might just love this free list of companies. (Hint: insiders have been buying them).
We aim to bring you long-term focused research analysis driven by fundamental data. Note that our analysis may not factor in the latest price-sensitive company announcements or qualitative material.
If you spot an error that warrants correction, please contact the editor at editorial-team@simplywallst.com. This article by Simply Wall St is general in nature. It does not constitute a recommendation to buy or sell any stock, and does not take account of your objectives, or your financial situation. Simply Wall St has no position in the stocks mentioned. Thank you for reading.

