Do You Like Oriental Press Group Limited (HKG:18) At This P/E Ratio?

The goal of this article is to teach you how to use price to earnings ratios (P/E ratios). We’ll look at Oriental Press Group Limited’s (HKG:18) P/E ratio and reflect on what it tells us about the company’s share price. Based on the last twelve months, Oriental Press Group’s P/E ratio is 16.02. That means that at current prices, buyers pay HK$16.02 for every HK$1 in trailing yearly profits.
See our latest analysis for Oriental Press Group
Want to help shape the future of investing tools and platforms? Take the survey and be part of one of the most advanced studies of stock market investors to date.
How Do I Calculate A Price To Earnings Ratio?
The formula for price to earnings is:
Price to Earnings Ratio = Share Price ÷ Earnings per Share (EPS)
Or for Oriental Press Group:
P/E of 16.02 = HK$0.82 ÷ HK$0.051 (Based on the year to September 2018.)
Is A High Price-to-Earnings Ratio Good?
A higher P/E ratio implies that investors pay a higher price for the earning power of the business. That isn’t a good or a bad thing on its own, but a high P/E means that buyers have a higher opinion of the business’s prospects, relative to stocks with a lower P/E.
How Growth Rates Impact P/E Ratios
Earnings growth rates have a big influence on P/E ratios. When earnings grow, the ‘E’ increases, over time. That means unless the share price increases, the P/E will reduce in a few years. A lower P/E should indicate the stock is cheap relative to others — and that may attract buyers.
Oriental Press Group saw earnings per share decrease by 32% last year. But over the longer term (5 years) earnings per share have increased by 14%.
How Does Oriental Press Group’s P/E Ratio Compare To Its Peers?
We can get an indication of market expectations by looking at the P/E ratio. If you look at the image below, you can see Oriental Press Group has a lower P/E than the average (20.6) in the media industry classification.
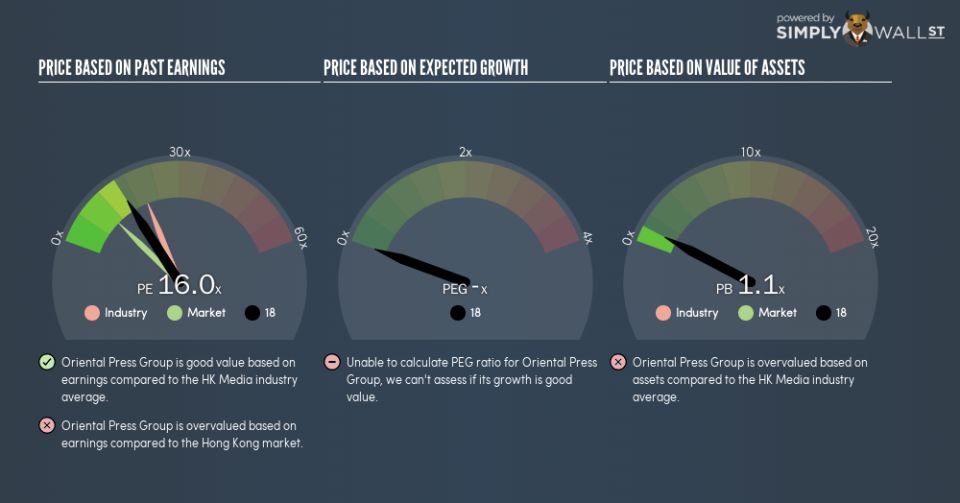
Its relatively low P/E ratio indicates that Oriental Press Group shareholders think it will struggle to do as well as other companies in its industry classification. While current expectations are low, the stock could be undervalued if the situation is better than the market assumes. If you consider the stock interesting, further research is recommended. For example, I often monitor director buying and selling.
A Limitation: P/E Ratios Ignore Debt and Cash In The Bank
It’s important to note that the P/E ratio considers the market capitalization, not the enterprise value. In other words, it does not consider any debt or cash that the company may have on the balance sheet. Theoretically, a business can improve its earnings (and produce a lower P/E in the future), by taking on debt (or spending its remaining cash).
Such expenditure might be good or bad, in the long term, but the point here is that the balance sheet is not reflected by this ratio.
Oriental Press Group’s Balance Sheet
Oriental Press Group has net cash of HK$527m. That should lead to a higher P/E than if it did have debt, because its strong balance sheets gives it more options.
The Verdict On Oriental Press Group’s P/E Ratio
Oriental Press Group has a P/E of 16. That’s higher than the average in the HK market, which is 10.4. The recent drop in earnings per share would make some investors cautious, but the healthy balance sheet means the company retains potential for future growth. If fails to eventuate, the current high P/E could prove to be temporary, as the share price falls.
Investors should be looking to buy stocks that the market is wrong about. As value investor Benjamin Graham famously said, ‘In the short run, the market is a voting machine but in the long run, it is a weighing machine.’ We don’t have analyst forecasts, but shareholders might want to examine this detailed historical graph of earnings, revenue and cash flow.
But note: Oriental Press Group may not be the best stock to buy. So take a peek at this free list of interesting companies with strong recent earnings growth (and a P/E ratio below 20).
To help readers see past the short term volatility of the financial market, we aim to bring you a long-term focused research analysis purely driven by fundamental data. Note that our analysis does not factor in the latest price-sensitive company announcements.
The author is an independent contributor and at the time of publication had no position in the stocks mentioned. For errors that warrant correction please contact the editor at editorial-team@simplywallst.com.
