Here’s How P/E Ratios Can Help Us Understand Thelloy Development Group Limited (HKG:1546)

Want to participate in a short research study? Help shape the future of investing tools and receive a $20 prize!
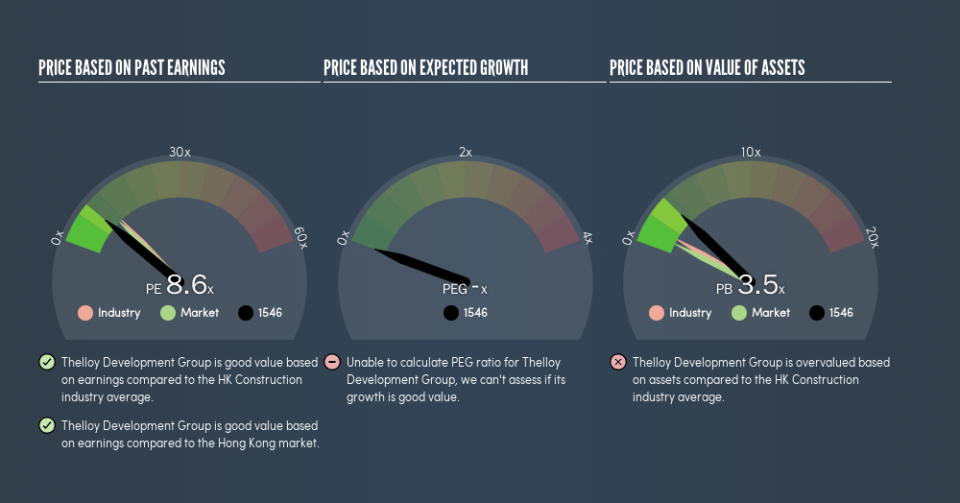
This article is written for those who want to get better at using price to earnings ratios (P/E ratios). We’ll look at Thelloy Development Group Limited’s (HKG:1546) P/E ratio and reflect on what it tells us about the company’s share price. Thelloy Development Group has a P/E ratio of 8.55, based on the last twelve months. That means that at current prices, buyers pay HK$8.55 for every HK$1 in trailing yearly profits.
Check out our latest analysis for Thelloy Development Group
How Do I Calculate A Price To Earnings Ratio?
The formula for P/E is:
Price to Earnings Ratio = Share Price ÷ Earnings per Share (EPS)
Or for Thelloy Development Group:
P/E of 8.55 = HK$0.55 ÷ HK$0.064 (Based on the year to September 2018.)
Is A High P/E Ratio Good?
A higher P/E ratio implies that investors pay a higher price for the earning power of the business. That isn’t necessarily good or bad, but a high P/E implies relatively high expectations of what a company can achieve in the future.
How Growth Rates Impact P/E Ratios
Earnings growth rates have a big influence on P/E ratios. That’s because companies that grow earnings per share quickly will rapidly increase the ‘E’ in the equation. That means unless the share price increases, the P/E will reduce in a few years. So while a stock may look expensive based on past earnings, it could be cheap based on future earnings.
It’s great to see that Thelloy Development Group grew EPS by 10% in the last year. And its annual EPS growth rate over 5 years is 59%. With that performance, you might expect an above average P/E ratio.
How Does Thelloy Development Group’s P/E Ratio Compare To Its Peers?
The P/E ratio indicates whether the market has higher or lower expectations of a company. We can see in the image below that the average P/E (11.6) for companies in the construction industry is higher than Thelloy Development Group’s P/E.
Thelloy Development Group’s P/E tells us that market participants think it will not fare as well as its peers in the same industry. Many investors like to buy stocks when the market is pessimistic about their prospects. It is arguably worth checking if insiders are buying shares, because that might imply they believe the stock is undervalued.
Remember: P/E Ratios Don’t Consider The Balance Sheet
Don’t forget that the P/E ratio considers market capitalization. Thus, the metric does not reflect cash or debt held by the company. In theory, a company can lower its future P/E ratio by using cash or debt to invest in growth.
Such spending might be good or bad, overall, but the key point here is that you need to look at debt to understand the P/E ratio in context.
How Does Thelloy Development Group’s Debt Impact Its P/E Ratio?
The extra options and safety that comes with Thelloy Development Group’s HK$219m net cash position means that it deserves a higher P/E than it would if it had a lot of net debt.
The Bottom Line On Thelloy Development Group’s P/E Ratio
Thelloy Development Group has a P/E of 8.6. That’s below the average in the HK market, which is 10.8. It grew its EPS nicely over the last year, and the healthy balance sheet implies there is more potential for growth. The relatively low P/E ratio implies the market is pessimistic.
Investors have an opportunity when market expectations about a stock are wrong. If it is underestimating a company, investors can make money by buying and holding the shares until the market corrects itself. Although we don’t have analyst forecasts, you could get a better understanding of its growth by checking out this more detailed historical graph of earnings, revenue and cash flow.
But note: Thelloy Development Group may not be the best stock to buy. So take a peek at this free list of interesting companies with strong recent earnings growth (and a P/E ratio below 20).
We aim to bring you long-term focused research analysis driven by fundamental data. Note that our analysis may not factor in the latest price-sensitive company announcements or qualitative material.
If you spot an error that warrants correction, please contact the editor at editorial-team@simplywallst.com. This article by Simply Wall St is general in nature. It does not constitute a recommendation to buy or sell any stock, and does not take account of your objectives, or your financial situation. Simply Wall St has no position in the stocks mentioned. Thank you for reading.
