Here’s How P/E Ratios Can Help Us Understand Shanshan Brand Management Co., Ltd. (HKG:1749)

The goal of this article is to teach you how to use price to earnings ratios (P/E ratios). To keep it practical, we’ll show how Shanshan Brand Management Co., Ltd.’s (HKG:1749) P/E ratio could help you assess the value on offer. Based on the last twelve months, Shanshan Brand Management’s P/E ratio is 3.58. That corresponds to an earnings yield of approximately 28%.
View our latest analysis for Shanshan Brand Management
How Do I Calculate A Price To Earnings Ratio?
The formula for price to earnings is:
Price to Earnings Ratio = Price per Share (in the reporting currency) ÷ Earnings per Share (EPS)
Or for Shanshan Brand Management:
P/E of 3.58 = CN¥1.48 (Note: this is the share price in the reporting currency, namely, CNY ) ÷ CN¥0.41 (Based on the year to June 2018.)
Is A High Price-to-Earnings Ratio Good?
A higher P/E ratio implies that investors pay a higher price for the earning power of the business. That isn’t necessarily good or bad, but a high P/E implies relatively high expectations of what a company can achieve in the future.
How Growth Rates Impact P/E Ratios
Earnings growth rates have a big influence on P/E ratios. When earnings grow, the ‘E’ increases, over time. Therefore, even if you pay a high multiple of earnings now, that multiple will become lower in the future. Then, a lower P/E should attract more buyers, pushing the share price up.
Shanshan Brand Management increased earnings per share by 3.0% last year.
How Does Shanshan Brand Management’s P/E Ratio Compare To Its Peers?
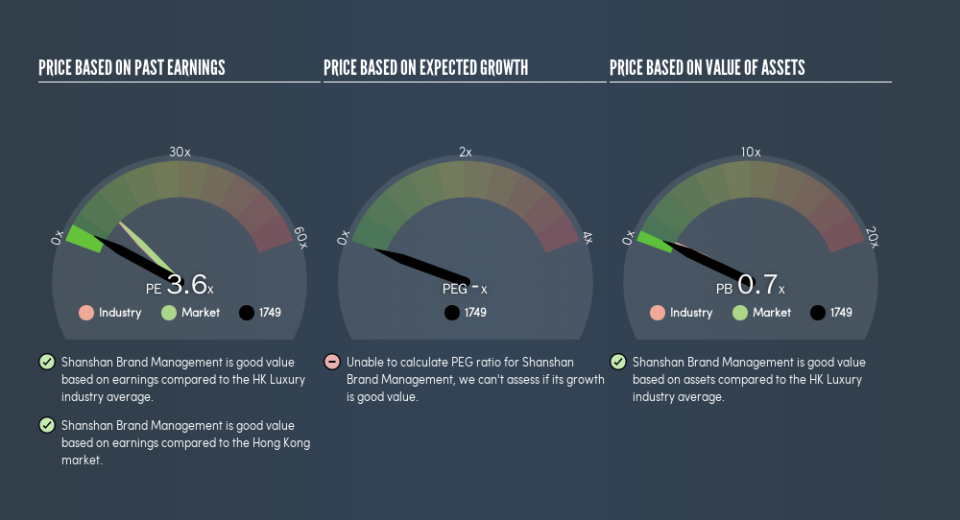
We can get an indication of market expectations by looking at the P/E ratio. The image below shows that Shanshan Brand Management has a lower P/E than the average (10.5) P/E for companies in the luxury industry.
Its relatively low P/E ratio indicates that Shanshan Brand Management shareholders think it will struggle to do as well as other companies in its industry classification. Many investors like to buy stocks when the market is pessimistic about their prospects. If you consider the stock interesting, further research is recommended. For example, I often monitor director buying and selling.
Don’t Forget: The P/E Does Not Account For Debt or Bank Deposits
It’s important to note that the P/E ratio considers the market capitalization, not the enterprise value. In other words, it does not consider any debt or cash that the company may have on the balance sheet. Theoretically, a business can improve its earnings (and produce a lower P/E in the future), by taking on debt (or spending its remaining cash).
Such expenditure might be good or bad, in the long term, but the point here is that the balance sheet is not reflected by this ratio.
How Does Shanshan Brand Management’s Debt Impact Its P/E Ratio?
Net debt totals 76% of Shanshan Brand Management’s market cap. This is enough debt that you’d have to make some adjustments before using the P/E ratio to compare it to a company with net cash.
The Verdict On Shanshan Brand Management’s P/E Ratio
Shanshan Brand Management has a P/E of 3.6. That’s below the average in the HK market, which is 10.9. It’s good to see EPS growth in the last 12 months, but the debt on the balance sheet might be muting expectations.
Investors have an opportunity when market expectations about a stock are wrong. If it is underestimating a company, investors can make money by buying and holding the shares until the market corrects itself. We don’t have analyst forecasts, but shareholders might want to examine this detailed historical graph of earnings, revenue and cash flow.
You might be able to find a better buy than Shanshan Brand Management. If you want a selection of possible winners, check out this free list of interesting companies that trade on a P/E below 20 (but have proven they can grow earnings).
We aim to bring you long-term focused research analysis driven by fundamental data. Note that our analysis may not factor in the latest price-sensitive company announcements or qualitative material.
If you spot an error that warrants correction, please contact the editor at editorial-team@simplywallst.com. This article by Simply Wall St is general in nature. It does not constitute a recommendation to buy or sell any stock, and does not take account of your objectives, or your financial situation. Simply Wall St has no position in the stocks mentioned. Thank you for reading.
