Here’s How P/E Ratios Can Help Us Understand UET United Electronic Technology AG (ETR:CFC)

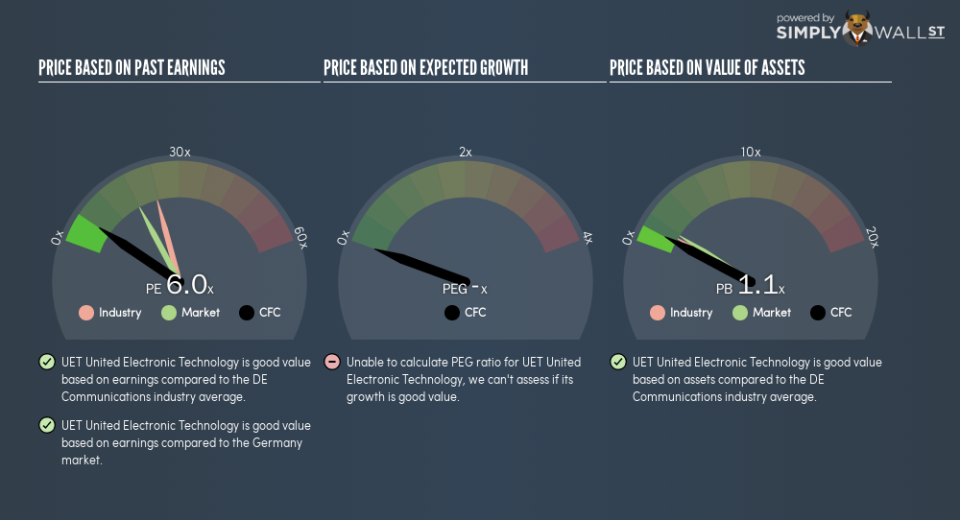
This article is written for those who want to get better at using price to earnings ratios (P/E ratios). We’ll look at UET United Electronic Technology AG’s (ETR:CFC) P/E ratio and reflect on what it tells us about the company’s share price. Based on the last twelve months, UET United Electronic Technology’s P/E ratio is 6.05. That corresponds to an earnings yield of approximately 17%.
View our latest analysis for UET United Electronic Technology
How Do I Calculate A Price To Earnings Ratio?
The formula for P/E is:
Price to Earnings Ratio = Price per Share ÷ Earnings per Share (EPS)
Or for UET United Electronic Technology:
P/E of 6.05 = €0.90 ÷ €0.15 (Based on the trailing twelve months to June 2018.)
Is A High Price-to-Earnings Ratio Good?
A higher P/E ratio implies that investors pay a higher price for the earning power of the business. That isn’t necessarily good or bad, but a high P/E implies relatively high expectations of what a company can achieve in the future.
How Growth Rates Impact P/E Ratios
Earnings growth rates have a big influence on P/E ratios. When earnings grow, the ‘E’ increases, over time. That means unless the share price increases, the P/E will reduce in a few years. So while a stock may look expensive based on past earnings, it could be cheap based on future earnings.
UET United Electronic Technology shrunk earnings per share by 56% over the last year. But it has grown its earnings per share by 20% per year over the last three years. And over the longer term (5 years) earnings per share have decreased 5.0% annually. This might lead to muted expectations.
How Does UET United Electronic Technology’s P/E Ratio Compare To Its Peers?
The P/E ratio indicates whether the market has higher or lower expectations of a company. The image below shows that UET United Electronic Technology has a lower P/E than the average (23.5) P/E for companies in the communications industry.
UET United Electronic Technology’s P/E tells us that market participants think it will not fare as well as its peers in the same industry. Many investors like to buy stocks when the market is pessimistic about their prospects. You should delve deeper. I like to check if company insiders have been buying or selling.
Remember: P/E Ratios Don’t Consider The Balance Sheet
The ‘Price’ in P/E reflects the market capitalization of the company. Thus, the metric does not reflect cash or debt held by the company. In theory, a company can lower its future P/E ratio by using cash or debt to invest in growth.
Spending on growth might be good or bad a few years later, but the point is that the P/E ratio does not account for the option (or lack thereof).
How Does UET United Electronic Technology’s Debt Impact Its P/E Ratio?
UET United Electronic Technology’s net debt is 16% of its market cap. This could bring some additional risk, and reduce the number of investment options for management; worth remembering if you compare its P/E to businesses without debt.
The Bottom Line On UET United Electronic Technology’s P/E Ratio
UET United Electronic Technology has a P/E of 6. That’s below the average in the DE market, which is 17.9. With only modest debt, it’s likely the lack of EPS growth at least partially explains the pessimism implied by the P/E ratio.
Investors have an opportunity when market expectations about a stock are wrong. As value investor Benjamin Graham famously said, ‘In the short run, the market is a voting machine but in the long run, it is a weighing machine.’ We don’t have analyst forecasts, but you could get a better understanding of its growth by checking out this more detailed historical graph of earnings, revenue and cash flow.
But note: UET United Electronic Technology may not be the best stock to buy. So take a peek at this free list of interesting companies with strong recent earnings growth (and a P/E ratio below 20).
To help readers see past the short term volatility of the financial market, we aim to bring you a long-term focused research analysis purely driven by fundamental data. Note that our analysis does not factor in the latest price-sensitive company announcements.
The author is an independent contributor and at the time of publication had no position in the stocks mentioned. For errors that warrant correction please contact the editor at editorial-team@simplywallst.com.
