Here’s How P/E Ratios Can Help Us Understand Northrop Grumman Corporation (NYSE:NOC)

Want to participate in a short research study? Help shape the future of investing tools and receive a $20 prize!
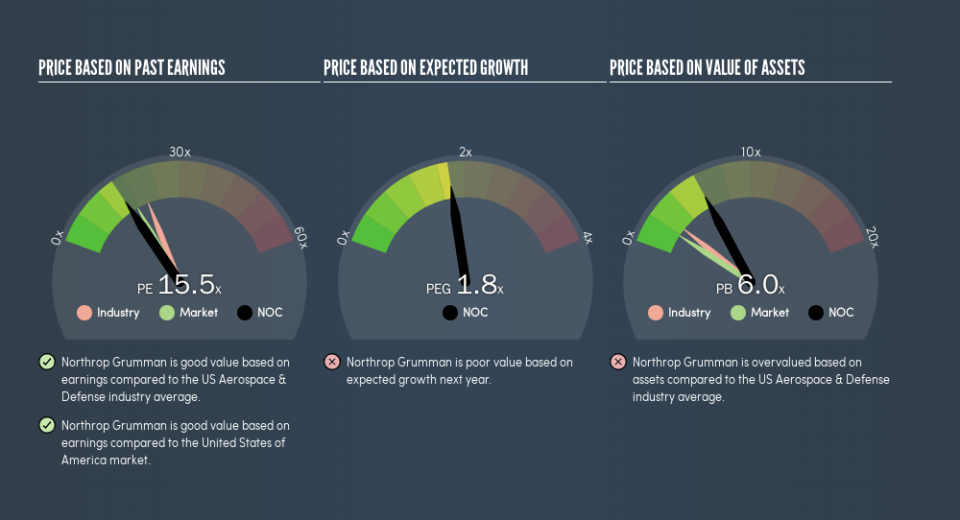
The goal of this article is to teach you how to use price to earnings ratios (P/E ratios). We’ll show how you can use Northrop Grumman Corporation’s (NYSE:NOC) P/E ratio to inform your assessment of the investment opportunity. Northrop Grumman has a price to earnings ratio of 15.47, based on the last twelve months. That is equivalent to an earnings yield of about 6.5%.
See our latest analysis for Northrop Grumman
How Do I Calculate Northrop Grumman’s Price To Earnings Ratio?
The formula for P/E is:
Price to Earnings Ratio = Share Price ÷ Earnings per Share (EPS)
Or for Northrop Grumman:
P/E of 15.47 = $287.5 ÷ $18.59 (Based on the trailing twelve months to December 2018.)
Is A High Price-to-Earnings Ratio Good?
A higher P/E ratio implies that investors pay a higher price for the earning power of the business. That isn’t a good or a bad thing on its own, but a high P/E means that buyers have a higher opinion of the business’s prospects, relative to stocks with a lower P/E.
How Growth Rates Impact P/E Ratios
Earnings growth rates have a big influence on P/E ratios. Earnings growth means that in the future the ‘E’ will be higher. Therefore, even if you pay a high multiple of earnings now, that multiple will become lower in the future. So while a stock may look expensive based on past earnings, it could be cheap based on future earnings.
It’s great to see that Northrop Grumman grew EPS by 13% in the last year. And its annual EPS growth rate over 5 years is 13%. So one might expect an above average P/E ratio.
How Does Northrop Grumman’s P/E Ratio Compare To Its Peers?
We can get an indication of market expectations by looking at the P/E ratio. If you look at the image below, you can see Northrop Grumman has a lower P/E than the average (20.8) in the aerospace & defense industry classification.
Northrop Grumman’s P/E tells us that market participants think it will not fare as well as its peers in the same industry. While current expectations are low, the stock could be undervalued if the situation is better than the market assumes. It is arguably worth checking if insiders are buying shares, because that might imply they believe the stock is undervalued.
A Limitation: P/E Ratios Ignore Debt and Cash In The Bank
It’s important to note that the P/E ratio considers the market capitalization, not the enterprise value. That means it doesn’t take debt or cash into account. Hypothetically, a company could reduce its future P/E ratio by spending its cash (or taking on debt) to achieve higher earnings.
Such spending might be good or bad, overall, but the key point here is that you need to look at debt to understand the P/E ratio in context.
Northrop Grumman’s Balance Sheet
Net debt totals 27% of Northrop Grumman’s market cap. If you want to compare its P/E ratio to other companies, you should absolutely keep in mind it has significant borrowings.
The Verdict On Northrop Grumman’s P/E Ratio
Northrop Grumman trades on a P/E ratio of 15.5, which is below the US market average of 17.5. The EPS growth last year was strong, and debt levels are quite reasonable. The low P/E ratio suggests current market expectations are muted, implying these levels of growth will not continue.
When the market is wrong about a stock, it gives savvy investors an opportunity. If the reality for a company is not as bad as the P/E ratio indicates, then the share price should increase as the market realizes this. So this free visual report on analyst forecasts could hold the key to an excellent investment decision.
You might be able to find a better buy than Northrop Grumman. If you want a selection of possible winners, check out this free list of interesting companies that trade on a P/E below 20 (but have proven they can grow earnings).
We aim to bring you long-term focused research analysis driven by fundamental data. Note that our analysis may not factor in the latest price-sensitive company announcements or qualitative material.
If you spot an error that warrants correction, please contact the editor at editorial-team@simplywallst.com. This article by Simply Wall St is general in nature. It does not constitute a recommendation to buy or sell any stock, and does not take account of your objectives, or your financial situation. Simply Wall St has no position in the stocks mentioned. Thank you for reading.
