Papa John's (PZZA) Q4 Earnings & Revenues Beat Estimates
Papa John’s International, Inc. PZZA reported strong fourth-quarter 2019 results, with earnings and revenues beating the Zacks Consensus Estimate.
In spite of reporting better-than-expected results, shares of the company declined 8.7% on Feb 26. Notably, temporary closure of franchised stores in China due to coronavirus outbreak as well as decline in same-store sales for 2019 and soft 2020 outlook have hurt investors’ sentiments.
Adjusted earnings of 37 cents per share beat the Zacks Consensus Estimate of 32 cents by 15.6%. The bottom line also surged 105.6% from the year-ago quarter’s reported figure.
Papa John's International, Inc. Price, Consensus and EPS Surprise
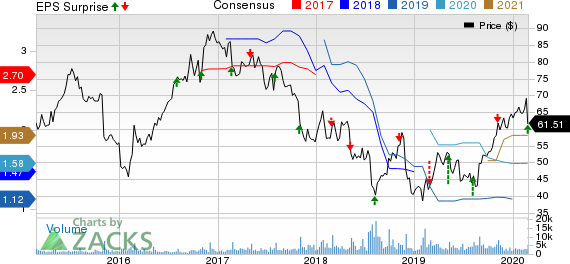
Papa John's International, Inc. price-consensus-eps-surprise-chart | Papa John's International, Inc. Quote
Revenues totaled $417.5 million, which outpaced the Zacks Consensus Estimate of $406.5 million. The top line also increased 5% on a year-over-year basis. The upside can be attributed to positive comparable sales achieved by the company in North America, higher commissary revenues related to increased commodity cost as well as increased marketing fund revenues primarily due to an increase in the PJMF contribution rate and higher online revenues.
During the fourth quarter, Papa John’s opened 19 restaurants in North America and exited 27, with the global restaurant count being 5,395. Currently, the company is operating in 49 countries and territories worldwide.
Global Restaurant Sales & Comps
In the fourth quarter, global restaurant sales moved up 4.4% against the year-ago quarter’s fall of 13%. Excluding foreign currency impact, global restaurant sales rose 4.7% against the year-ago quarter’s decline of 11.7%.
Domestic company-owned restaurant comps moved up 4.1% in the reported quarter versus a 10.2% decline in the year-ago quarter.
At North America franchised restaurants, comps rose 3.3% against a decline of 7.4% in fourth-quarter 2018. Also, comps at system-wide North America restaurants moved up 3.5% against 8.1% decline recorded in the year-ago quarter. The company reported its second straight quarter of same-store sales growth in North America.
Comps at system-wide international restaurants were up 2.4% against a decline of 2.6% in the prior-year quarter.
Operating Highlights
Total operating loss was $0.13 million in the fourth quarter compared with operating loss of $7.3 million in the year-ago quarter. Total costs and expenses amounted to $420.5 million, up 3.4% from fourth-quarter 2018 levels.
Balance Sheet
As of Dec 29, 2019, cash and cash equivalents totaled $27.9 million compared with $33.3 million as on Dec 30, 2018. Long-term debt was $347.3 million at the end of fourth-quarter 2019 compared with $601.1 million at 2018-end.
Inventories at the end of the reported quarter increased to $27.5 million from $27.2 million on Dec 30, 2018. Free cash flow at the end of fourth-quarter 2019 summed $14 million compared with $50.4 million at 2018-end.
The company paid out cash dividends worth $10.6 million in fourth-quarter 2019 and declared first-quarter 2020 cash dividend of approximately $10.7 million.
2019 Highlights
In 2019, total revenues amounted to $1,619.2 million compared with $1,662.9 million in 2018.
Adjusted earnings per share (EPS) for the year ended on Dec 29, 2019 were $1.17 compared with $1.37 on Dec 30, 2018.
In 2019, System-wide North America comparable sales declined 2.2% compared with 7.3% fall in 2018.
2020 Outlook
Papa John's expects adjusted EPS in the range of $1.35-$1.55. North America comps are now expected in the range of 2.5-5%. International comps are anticipated between 1.5% and 4%. Capital expenditures for 2020 are still expected in the range of $40-$50 million. Additionally, net global unit growth is anticipated in the band of 100-140 units.
Zacks Rank & Other Key Picks
Papa John's currently carries a Zacks Rank #2 (Buy). You can see the complete list of today’s Zacks #1(Strong Buy) Rank stocks here.
Few top-ranked stocks in the same space are Texas Roadhouse, Inc. TXRH, Brinker International, Inc. EAT and Chipotle Mexican Grill, Inc. CMG. Texas Roadhouse sports a Zacks Rank #1, while Brinker International and Chipotle Mexican Grill carry a Zacks Rank #2 (Buy).
Texas Roadhouse has trailing four-quarter positive earnings surprise of 4.3%, on average. The company’s earnings beat estimates in three of the last four quarters.
2020 earnings for Brinker International is expected to rise 10.2%.
Chipotle Mexican Grill has an expected three-five year EPS growth rate of 19.3%.
Today's Best Stocks from Zacks
Would you like to see the updated picks from our best market-beating strategies? From 2017 through 2019, while the S&P 500 gained and impressive +53.6%, five of our strategies returned +65.8%, +97.1%, +118.0%, +175.7% and even +186.7%.
This outperformance has not just been a recent phenomenon. From 2000 – 2019, while the S&P averaged +6.0% per year, our top strategies averaged up to +54.7% per year.
See their latest picks free >>
Want the latest recommendations from Zacks Investment Research? Today, you can download 7 Best Stocks for the Next 30 Days. Click to get this free report
Brinker International, Inc. (EAT) : Free Stock Analysis Report
Texas Roadhouse, Inc. (TXRH) : Free Stock Analysis Report
Papa John's International, Inc. (PZZA) : Free Stock Analysis Report
Chipotle Mexican Grill, Inc. (CMG) : Free Stock Analysis Report
To read this article on Zacks.com click here.
Zacks Investment Research
